This Grade 10–11 mathematics worksheet gives students focused practice graphing and interpreting exponential functions. Across 20 multiple-choice questions, students classify graphs as exponential growth, exponential decay, or logarithmic; determine whether equations represent growth or decay; identify the function represented by a graph; and select the graph that matches a given equation. Several items require students to connect the base, coefficient, and visible graph features rather than relying on a single representation.
The worksheet is useful for introducing or reviewing how exponential equations and graphs correspond, especially when students are learning to distinguish growth from decay and recognize the equation associated with a graph. Teachers can use the questions for independent practice, a quick formative assessment, or discussion after students explain why an equation or graph is the best match. This free printable worksheet includes a complete answer key for efficient checking and feedback.
Worksheet settings
Font size
S
M
L
XL
Worksheets
2023 - 2024 - Graphing Exponentials
Total questions: 20
Name
Class
Date
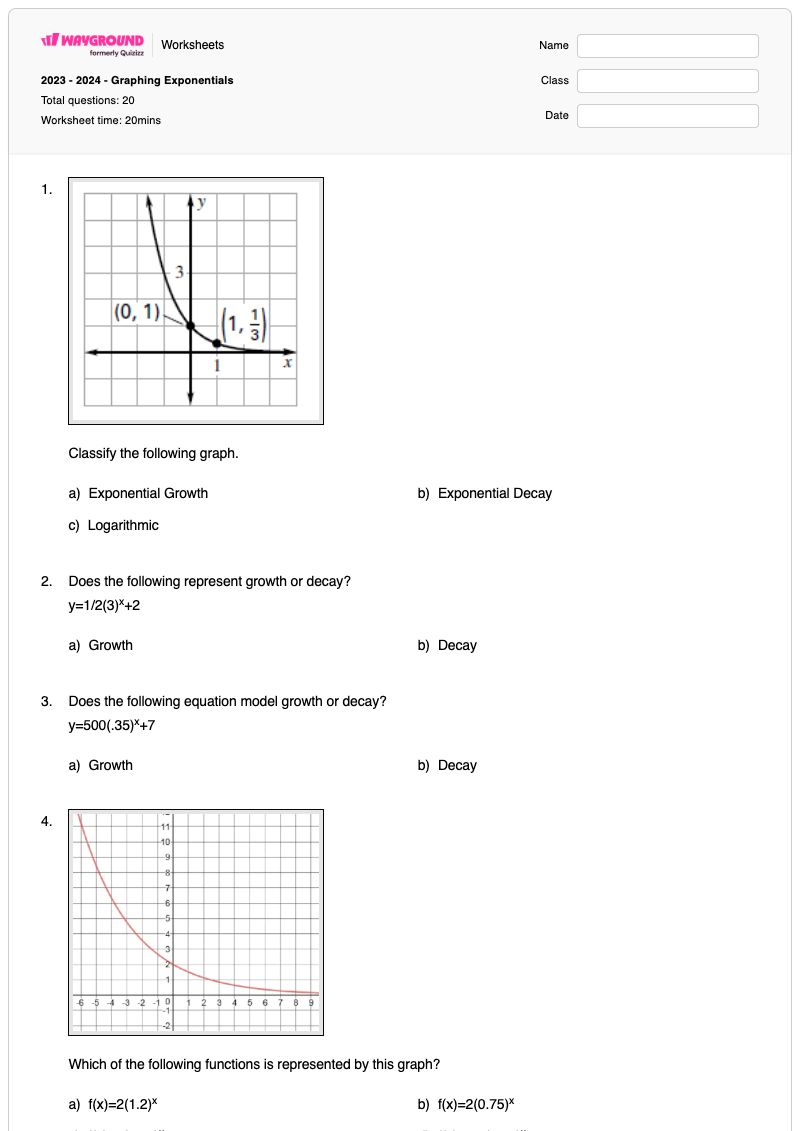
1.
Classify the following graph.
a)
Exponential Growth
b)
Exponential Decay
c)
Logarithmic
2.
Does the following represent growth or decay? y=1/2(3)x+2
a)
Growth
b)
Decay
3.
Does the following equation model growth or decay? y=500(.35)x+7
a)
Growth
b)
Decay
4.
Which of the following functions is represented by this graph?
a)
f(x)=2(1.2)x
b)
f(x)=2(0.75)x
c)
f(x)=6(0.75)x
d)
f(x)= −2(0.75)x
5.
Which equation matches the graph?
a)
y = 2x+3
b)
y = 2x + 3
c)
y = 2x
d)
y = 2-x
6.
What type of function is y = 7(1.25)x?
a)
Exponential Growth
b)
Exponential Decay
c)
Linear
d)
None of the above
7.
Choose the graph the matches the equation: f(x)=5(2)x
a)
b)
c)
d)
8.
Choose the graph that matches the equation: f(x)=4(21)x
a)
b)
c)
d)
9.
Choose the graph that matches the equation: f(x)=4(2)x
a)
b)
c)
d)
10.
Choose the graph that matches the equation: f(x)=2(2)x
a)
b)
c)
d)
11.
Choose the graph that matches the equation: f(x)=3(21)x
a)
b)
c)
d)
12.
Choose the graph that matches the equation: f(x)=41(2)x
a)
b)
c)
d)
13.
Choose the graph that matches the equation: f(x)=21(6)x
a)
b)
c)
d)
14.
Choose the graph that matches the equation: f(x)=2(21)x
a)
b)
c)
d)
15.
Which equation matches this graph?
a)
b)
c)
d)
16.
Which graph matches the equation?
a)
b)
c)
d)
17.
Determine the range for the function. f(x)=2x−4+5
a)
y > 4
b)
y > 2
c)
y > 3
d)
y > 5
18.
What is the asymptote for the equation y=2x+5−7 ?
a)
y = -7
b)
y = 7
c)
y = 5
d)
x = 2
19.
Determine the horizontal asymptote for the function
f(x) = 3(2)x-4 + 5
a)
x=4
b)
y=4
c)
x=5
d)
y=5
20.
On the graph y = 4x + 2.
What is the domain?
a)
x > 0
b)
x > 2
c)
x > 4
d)
All real numbers
Answer Key
2023 - 2024 - Graphing Exponentials
Total questions: 20
1.
b) Exponential Decay
2.
a) Growth
3.
b) Decay
4.
b) f(x)=2(0.75)x
5.
b) y = 2x + 3
6.
a)
Exponential Growth
7.
d)
8.
b)
9.
b)
10.
b)
11.
d)
12.
d)
13.
a)
14.
d)
15.
d)
16.
a)
17.
d)
y > 5
18.
a)
y = -7
19.
d)
y=5
20.
d)
All real numbers
140 %
Browse by subjects
Browse by grades
Browse by format
FAQs
What does this worksheet cover about graphing exponential functions?
This worksheet covers interpreting exponential functions through 20 multiple-choice questions. Students classify graphs as exponential growth, exponential decay, or logarithmic, identify growth or decay from equations, and match exponential equations with their corresponding graphs. These tasks build fluency in moving between an equation and its visual representation.
How can I use this worksheet to teach exponential growth and decay?
Introduce the worksheet by reviewing how the base in an exponential equation indicates growth or decay, then model how to compare an equation with a graph. Have students explain their choices for the growth-and-decay items before completing the graph-to-equation and equation-to-graph questions independently. Use the matching questions to prompt discussion about how coefficients, bases, and other visible features affect the graph.
What mistakes should I watch for when students complete this exponential graphing worksheet?
Watch for students labeling growth or decay from the coefficient alone instead of examining the exponential base. When matching equations and graphs, students may choose a function with the right general direction but overlook differences in the coefficient, base, sign, or added constant. Students may also confuse an exponential graph with the logarithmic option in the classification question.
How do I assign and grade this exponential functions worksheet?
This worksheet is available as a printable PDF and as a digital quiz on Wayground, and it includes a complete answer key. Assign the PDF for written practice or use the digital version for online responses; printable submissions can also be graded by scanning student work with the Wayground for Teachers app. The printable format can support schools that are reducing screen time.
How can I differentiate this worksheet for students who need support with exponential graphs?
Use the worksheet’s Advanced Settings to adjust font spacing or font size so the graph-and-equation choices are easier to read. You can also apply a dyslexia-friendly font or translate the worksheet into another language when that would help students access the multiple-choice items. These changes preserve the worksheet’s focus on classifying growth and decay and matching equations to graphs.
Where can I find more free worksheets like this on Wayground?
Wayground offers a comprehensive collection of free printable worksheets and practice problems across subjects, with downloadable PDFs and answer keys to help students master essential skills and concepts. Browse more resources at https://wayground.com/en-us/worksheets.

 Worksheets


