

Wayground
O4C2 Key Features of Graphs - Printable Math Worksheets 12th Grade - Wayground

O4C2 Key Features of Graphs

Kellie Stilson

Created by Kellie Stilson

15 questions

12th Grade

Math

Updated Sept 2026

This Grade 12 mathematics worksheet builds fluency with interpreting key features of graphs and functions. Students answer 15 questions—14 multiple choice and one multiple-select—about identifying maximums and minimums, distinguishing local from absolute extrema, determining domain and range, and identifying increasing, decreasing, and constant intervals. The worksheet also connects graph features to a temperature-over-time context. Students interpret the absolute maximum and minimum, read y-intercepts and specific values, explain what those points mean in context, and identify when a temperature occurs. It is a free printable worksheet with an answer key, suitable for guided practice, independent review, or checking students’ ability to read graph features in both symbolic and real-world settings.

Worksheet settings

Font size

S
M
L
XL
WaygroundWorksheets

O4C2 Key Features of Graphs

Total questions: 15

Name
Class
Date
1.
Does the graph have a maximum or minimum?
a)
maximum
b)
minimum
c)
neither
d)
both
2.
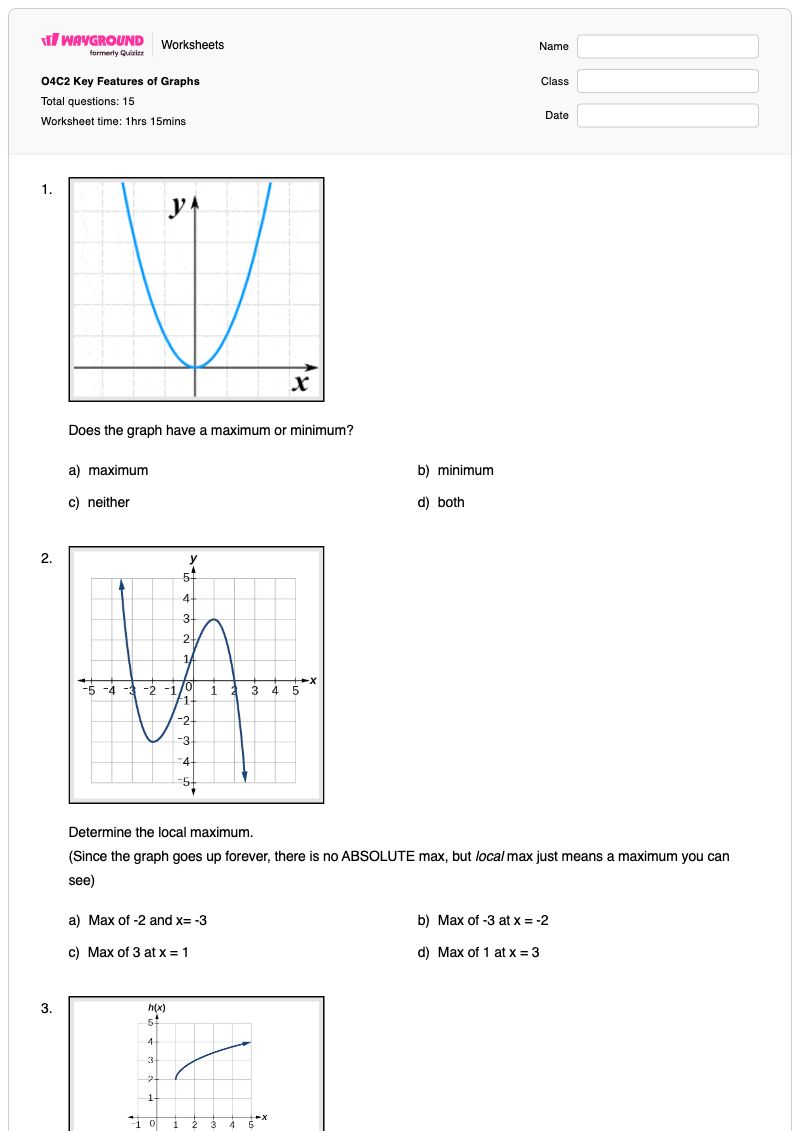
Determine the local maximum. (Since the graph goes up forever, there is no ABSOLUTE max, but local max just means a maximum…

Determine the local maximum.

(Since the graph goes up forever, there is no ABSOLUTE max, but local max just means a maximum you can see)

a)

Max of -2 and x= -3

b)

Max of -3 at x = -2

c)

Max of 3 at x = 1

d)

Max of 1 at x = 3

3.
Determine the domain of the graph.

Determine the domain of the graph.

a)

(1,∞)\left(1,\infty\right)

b)

(−∞,1)\left(-\infty,1\right)

c)

(2,∞)\left(2,\infty\right)

d)

(2,5)

4.
What is the interval of decrease for this function? (assume the graph continues past the edge)

What is the interval of decrease for this function?

(assume the graph continues past the edge)

a)

(-5, 3)

b)

(-∞,+∞)

c)

[-2, 6]

d)


(−2,∞)\left(-2,\infty\right)

5.
What is the domain of the function?

What is the domain of the function?

a)

95 to 116 degrees

b)

0 to 24

c)

0 to 120

d)

0 to 24 hours

6.
What is the range of the function?

What is the range of the function?

a)

95 to 116 degrees

b)

0 to 24

c)

0 to 120 degrees

d)

0 to 24 hours

7.
What is the absolute maximum?

What is the absolute maximum?

a)

116 degrees at 4 pm

b)

120 degrees

c)

24 hrs at 100 degrees

d)

0 hrs at 120 degrees

8.
What does the absolute maximum mean in context of the graph?

What does the absolute maximum mean in context of the graph?

a)

it's the highest point on the graph

b)

it's the highest temperature for the day

c)

it's the biggest number for the day

d)

It's the most time since midnight.

9.
What is the y-intercept?

What is the y-intercept?

a)

(0,100)

b)

(100,0)

c)

(115,0)

d)

(0,110)

10.
What does the y-intercept mean?

What does the y-intercept mean?

a)

100 degrees at midnight

b)

0 degrees at midnight

c)

115 degrees is where it crosses the y-axis

d)

110 degrees is where it's exactly on the line

11.
What is the absolute minimum?

What is the absolute minimum?

a)

4 hours at 98 degrees

b)

0 hours at 100 degrees

c)

0 degrees at midnight

d)

95 degrees at about 2 am

12.
What does the absolute minimum mean?

What does the absolute minimum mean?

a)

4 hours -- the least number of hours

b)

0 hours -- the smallest number of hours

c)

0 degrees -- the lowest temperature of the day

d)

95 degrees -- the lowest temperature of the day

13.
What is the temperature at 8 am?

What is the temperature at 8 am?

a)

102 degrees

b)

112 degrees

c)

95 degrees

d)

0 degrees

14.
When was it 100 degrees?

When was it 100 degrees?

a)

0 and 24 hours after midnight

b)

0, 7.5, and 24 hours after midnight

c)

0 hours

d)

24 hours

15.
List the types of intervals that the graph demonstrates in order.

List the types of intervals that the graph demonstrates in order.

a)

decreasing, constant, increasing, constant

b)

increasing, decreasing, constant

c)

increasing, constant, increasing, constant

d)

increasing, constant, decreasing, constant

WaygroundAnswer Key

O4C2 Key Features of Graphs

Total questions: 15

1.
b) minimum
2.
c)

Max of 3 at x = 1

3.
a)

(1,∞)\left(1,\infty\right)

4.
d)


(−2,∞)\left(-2,\infty\right)

5.
d)

0 to 24 hours

6.
a)

95 to 116 degrees

7.
a)

116 degrees at 4 pm

8.
b)

it's the highest temperature for the day

9.
a)

(0,100)

10.
a)

100 degrees at midnight

11.
d)

95 degrees at about 2 am

12.
d)

95 degrees -- the lowest temperature of the day

13.
a)

102 degrees

14.
b)

0, 7.5, and 24 hours after midnight

15.
d)

increasing, constant, decreasing, constant

FAQs

What does this worksheet cover, and how does it help students interpret graphs?

This Grade 12 worksheet uses 14 multiple-choice questions and one multiple-select question to practice identifying local and absolute maximums and minimums, domain, range, intercepts, and increasing, decreasing, and constant intervals. Several items use a temperature-versus-time graph, so students must connect coordinates and intervals to meanings such as the highest temperature, the lowest temperature, and the temperature at a given time.

How can I use this worksheet to teach key features of graphs?

Begin by reviewing how the x- and y-axes define domain and range, then model the difference between a visible local maximum and an absolute maximum over the entire graph. Use the temperature graph questions to have students explain what each coordinate means in context—for example, why the y-intercept represents the temperature at midnight—before assigning the remaining multiple-choice items and the final interval-order question.

What mistakes should I watch for when students complete this graph features worksheet?

Watch for students confusing a local maximum with an absolute maximum, or selecting an endpoint or x-value instead of the function’s output when identifying an extremum. Students may also reverse domain and range, report a coordinate instead of an interval, or read the temperature graph without attaching the correct units and time context. In the multiple-select item, check that they identify the intervals in the graph’s actual order rather than listing interval types from memory.

How do I assign and grade this worksheet?

Wayground provides this graph-features worksheet as a printable PDF and as a digital quiz, and it includes a complete answer key for all 15 questions. Printable submissions can be graded by scanning student work with the Wayground for Teachers app, while the digital quiz supports online assignment and grading.

How can I differentiate this worksheet for my students?

In the worksheet’s Advanced Settings, adjust font spacing or font size to make the graph-feature questions and answer choices easier to scan. You can also enable a dyslexia-friendly font or translate the worksheet into another language when those options better support students reading the domain, range, interval, and temperature-context items.

Where can I find more worksheets like this on Wayground?

Wayground offers a comprehensive collection of free printable worksheets and practice problems across all subjects, with downloadable PDFs and answer keys to help students master essential skills and concepts. Browse more resources at https://wayground.com/en-us/worksheets.