 Worksheets
Interpreting Dot Plots
Total questions: 11
Name
Class
Date


 Answer Key
Interpreting Dot Plots
Total questions: 11
1.
2.
3.
4.
5.
68
6.
c)
Skewed LEFT
7.
8.
b)
False
9.
b)
False
10.
b)
False
11.
c)
BOTH Sara and Javon


Created by Juana Hernandez
11 questions
6th Grade
Math
Updated Oct 2026
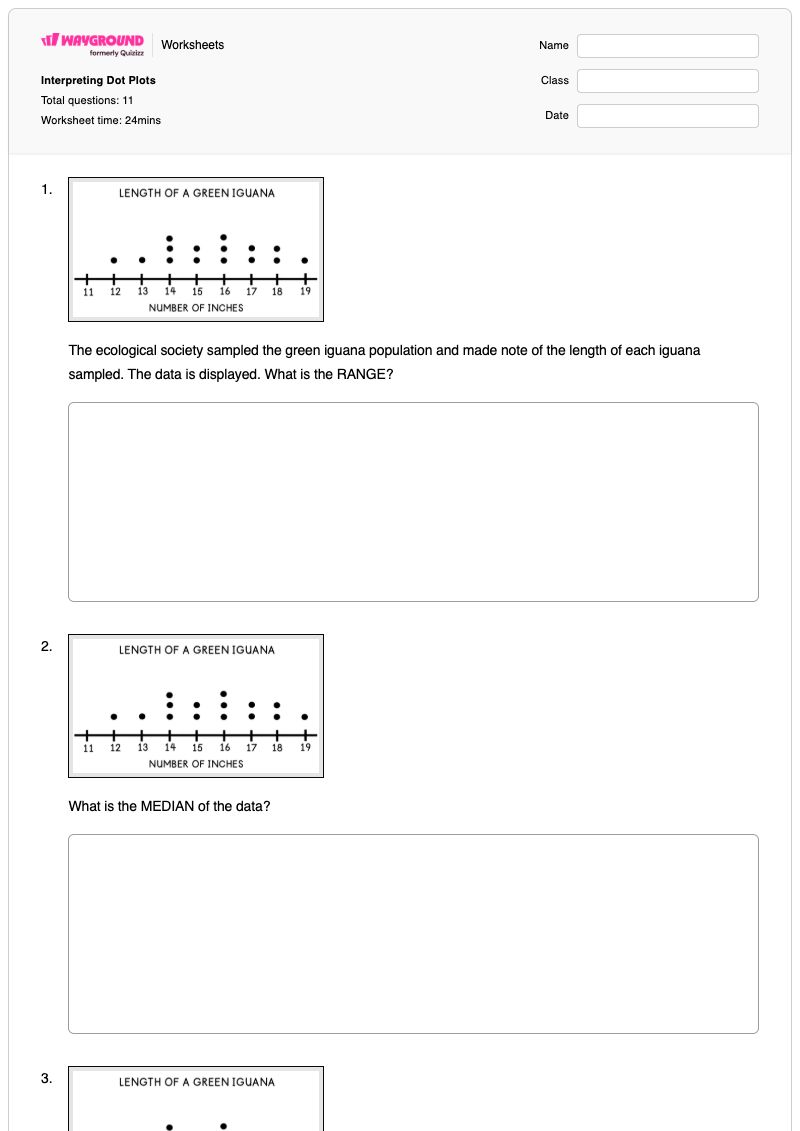
Interpreting Dot Plots is a Grade 6 math worksheet that helps students analyze data displayed on dot plots. Across 11 items, students calculate range, median, sum, and mean; identify a peak score; determine whether a distribution is symmetrical or skewed; and interpret statements about home-rating data. The worksheet combines five math-response questions, one dropdown item, and five multiple-choice questions, including true-or-false reasoning and a comparison of student-created dot plots. Use this free printable worksheet with students who are learning to connect visual data displays to numerical summaries and distributional features. The questions require students to read individual values and frequencies from dot plots, apply measures of center and spread, evaluate claims against the data, and recognize a symmetrical distribution with closely grouped data. A complete answer key is included for checking student work and supporting review.
Worksheet settings
Font size
WorksheetsAnswer Key
Skewed LEFT
False
False
False
BOTH Sara and Javon
This Grade 6 math worksheet develops students’ ability to read dot plots and use them to find the range, median, sum, and mean. Its 11 questions also ask students to identify a peak score, classify the data as symmetrical or skewed, evaluate statements about home ratings, and judge sketches of symmetrical, closely grouped dot plots.
Introduce the worksheet by reviewing how each dot represents a data value or occurrence, then model finding the endpoints, ordering values, and locating the center before students begin the math-response items. After students complete the dropdown and multiple-choice questions, discuss how the plotted shape supports conclusions about skew, ratings, and whether a student’s sketch is both symmetrical and close together.
Watch for students subtracting the wrong endpoints when finding range, choosing a middle-looking dot instead of determining the median from the ordered data, or confusing the sum with the mean. Students may also mistake the tallest stack for a general description of the distribution, reverse left and right skew, accept unsupported claims about the number or location of home ratings, or overlook that both sketches must satisfy the stated conditions.
Wayground provides this worksheet as a printable PDF and as a digital quiz, with a complete answer key for all 11 items. You can grade printable submissions by scanning student work with the Wayground for Teachers app, or review responses from the digital quiz.
In the worksheet’s Advanced Settings, adjust font spacing or choose a larger font size to make the dot plot questions, response areas, dropdown, and answer choices easier to read. You can also apply a dyslexia-friendly font or translate the worksheet into another language while keeping the same dot plot practice and question structure.
Wayground offers a broad collection of free printable worksheets and practice problems across subjects, with downloadable PDFs and answer keys to support essential skills and concepts. Browse more worksheets at https://wayground.com/en-us/worksheets.