

Wayground
Simple, Theoretical, and Tree Diagrams Probability - Printable Mathematics Worksheets kindergarten - Wayground

Simple, Theoretical, and Tree Diagrams Probability

10 questions

7th - 7th Grade

Mathematics

Simple, Theoretical, and Tree Diagrams Probability is a free printable Grade 7 mathematics worksheet with an answer key. It develops probability reasoning through 10 varied items, including drag-and-drop vocabulary, decimal probability, matching events, multiple-choice questions, ordering outcomes from least to greatest, dropdown calculations, and a student-created tree diagram. Students work with simple probability, theoretical probability, equally likely outcomes, and total possible outcomes. The worksheet applies these ideas to coins, spinners, number cubes, marbles, and choosing student council representatives. Students calculate probabilities as fractions or decimals, estimate expected results from repeated trials, compare event likelihoods, identify possible outcomes in a tree diagram, and use the multiplication principle to count combinations. It is designed for Grade 7 math practice, guided instruction, independent review, or a formative check of students’ ability to represent and interpret probability.

Worksheet settings

Font size

S
M
L
XL
Worksheets

Simple, Theoretical, and Tree Diagrams Probability

Total questions: 10

Name
Class
Date
1.

P(event) = ​ (a)   /​ (b)  

Choose from the below words
desirable outcome
total outcomes
complement
complement
minimum outcome
probability
minimum outcomes
100
2.

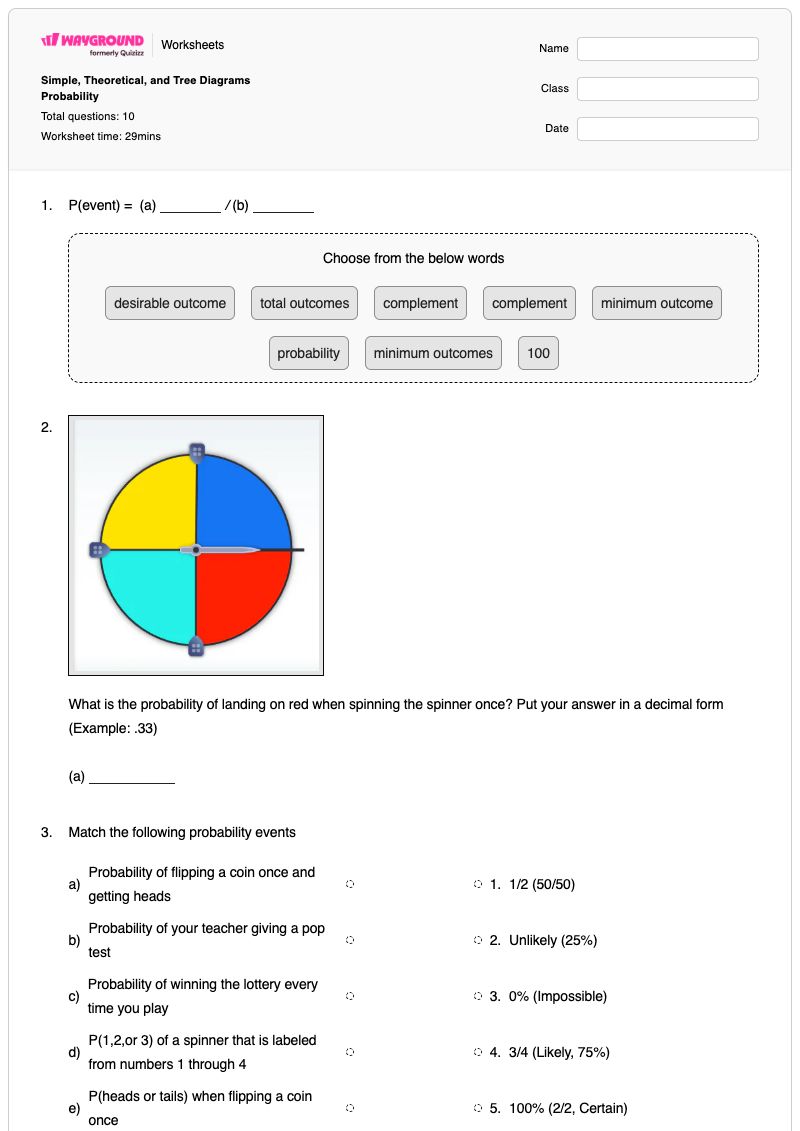
What is the probability of landing on red when spinning the spinner once? Put your answer in a decimal form (Example: .33)

(a)  

3.

Match the following probability events

Probability of flipping a coin once and getting heads

1/2 (50/50)

Probability of your teacher giving a pop test

Unlikely (25%)

Probability of winning the lottery every time you play

0% (Impossible)

P(1,2,or 3) of a spinner that is labeled from numbers 1 through 4

3/4 (Likely, 75%)

P(heads or tails) when flipping a coin once

100% (2/2, Certain)

4.

Dovanie flips a coin twice and drew a tree diagram to represent the possible outcomes. Did she draw her tree diagram correctly to fit the situation correctly?

a)

True

b)

False

5.

There is a number cube numbered from 1-6 being rolled once, order the answer choices from least to greatest of the probable events that may occur.

a)

P(7)

b)

P(all numbers)

c)

P(4)

d)

P(odds)

e)

P(1,2,5,or 6)

1)
2)
3)
4)
5)
6.

Draw a tree diagram to represent the situation. 7th graders are choosing one boy and one girl to represent them in student council. The boy representatives to choose from are Wyatt, Diego, and Stayve. The girl representatives to choose from are Ezabella, Harper, and Madalyn.

7.

Sandra flips a coin. The probability that the coin will land on tails is ​ (a)   . If Sandra flips the coin 26 times. The coin will land on tails ​ (b)  

times.

Choose from the below words
1/2
13
1/4
12
26
1/3
8.

If the spinner is spun 80 times, how often can you expect it to land on the yellow shaded section?

a)

15 times

b)

20 times

c)

25 times

d)

30 times

9.

Aspen has a bag of marbles containing 6 red marbles, 4 blue marbles, 2 yellow marbles, and three green marbles. There are ​ (a)   total marbles in the bag. Aspen wants to pull out a yellow marble and she says the probability of that is ​ (b)  

Choose from the below words
15
2/15
10
14
12
13
2/10
3/15
1/5
10.

Arihanna is going candy shopping before her movie. She wants to get one sour candy, one chocolate candy, and one sweet candy. In the candy aisle at Walmart there 4 chocolate options, 3 sour candy options, and 5 sweet candy options.

How many total possibilities are there for Arihanna to choose from?

a)

12 total outcomes

b)

17 total outcomes

c)

48 total outcomes

d)

60 total outcomes

Answer Key

Simple, Theoretical, and Tree Diagrams Probability

Total questions: 10

1.
desirable outcome, total outcomes
2.
.25, 0.25, 25%, 0.250
3.

Probability of flipping a coin once and getting heads

 - 

1/2 (50/50)

, 

Probability of your teacher giving a pop test

 - 

Unlikely (25%)

, 

Probability of winning the lottery every time you play

 - 

0% (Impossible)

, 

P(1,2,or 3) of a spinner that is labeled from numbers 1 through 4

 - 

3/4 (Likely, 75%)

, 

P(heads or tails) when flipping a coin once

 - 

100% (2/2, Certain)

4.
b)

False

5.
a, c, d, e, b
6.
n/a
7.
1/2, 13
8.
b)

20 times

9.
15, 2/15
10.
d)

60 total outcomes

FAQs

What does the Simple, Theoretical, and Tree Diagrams Probability worksheet cover?

This Grade 7 worksheet covers simple and theoretical probability, including probability as desirable outcomes over total outcomes, decimal representations, expected results from repeated trials, and comparisons of event likelihood. Its 10 items use drag-and-drop, fill-in-the-blank, matching, multiple choice, ordering, dropdown, and drawing formats, including a student-created tree diagram and a counting-outcomes problem.

How can I use this worksheet to teach simple probability and tree diagrams?

Introduce the worksheet by modeling how to identify desirable outcomes and total outcomes, then have students express a probability as a fraction or decimal using the spinner, coin, and marble situations. Before the tree-diagram items, ask students to list the first choice and second choice separately, such as the boy and girl representatives, and connect each complete branch to one possible outcome. Use the matching and ordering items for students to explain why some events are impossible, certain, or more likely than others.

What mistakes should I watch for when students complete this probability worksheet?

Watch for students using the number of desirable outcomes as the denominator, confusing a decimal such as 0.25 with 25, or failing to include every outcome when calculating spinner and marble probabilities. In the coin and student-council items, students may omit branches or create an incorrect tree diagram instead of showing each two-step combination. Students may also order events by the size of the numbers rather than by their probabilities, or add category counts when the candy problem requires multiplying choices.

How do I assign and grade this probability worksheet?

The worksheet is available on Wayground as a printable PDF and as a digital quiz, and it includes a complete answer key for the probability calculations, event comparisons, and tree-diagram work. You can grade printable submissions by scanning student work with the Wayground for Teachers app, or review responses in the digital version. The printable format also supports schools that want to reduce screen time.

How can I differentiate this probability worksheet for my students?

Use the worksheet’s Advanced Settings to adjust font spacing and font size so the probability expressions, answer choices, and tree-diagram prompts are easier to read. You can also apply a dyslexia-friendly font or translate the worksheet into another language, which can support access to the coin, spinner, marble, and student-council scenarios without changing the practice targets.

Where can I find more worksheets like this on Wayground?

Wayground offers a comprehensive collection of free printable worksheets and practice problems across all subjects, with downloadable PDFs and answer keys to help students master essential skills and concepts. Browse more resources at https://wayground.com/en-us/worksheets.