
WorksheetsAttributes of Quadratic Functions
Total questions: 20
Answer KeyAttributes of Quadratic Functions
Total questions: 20
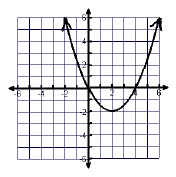
(0, 2)
The U-shaped graph of a quadratic function
(4, -6)
-∞ < x < ∞
-6 ≤ y < ∞
All of the above
y = 4x2 - 7x + 11

Created by Barbara White
20 questions
8th Grade
Math
Updated Apr 2026
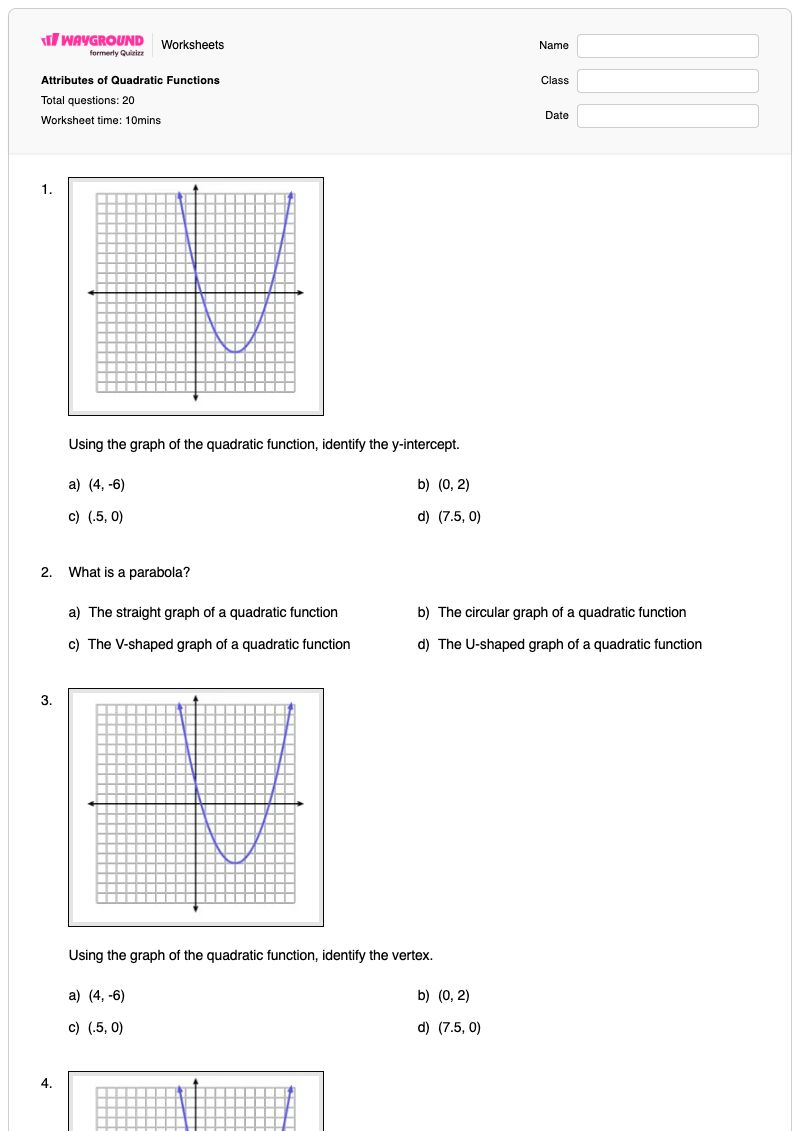
Attributes of Quadratic Functions is a Grade 8 mathematics worksheet that builds students’ ability to read and interpret quadratic-function graphs. Across 20 multiple-choice questions, students identify the y-intercept, vertex, axis of symmetry, domain, range, x-intercepts, roots or zeros, and maximum or minimum value. They also recognize a parabola, identify the number of solutions from a graph, and distinguish the standard form of a quadratic equation. This free printable worksheet gives students repeated practice connecting graph features with the vocabulary and representations used to describe quadratic functions. The selected-response format supports independent practice, review, or a quick check for understanding after instruction on parabolas and their attributes. A complete answer key is included so teachers can review students’ choices efficiently and address misconceptions about coordinates, intercepts, and solution sets.
Worksheet settings
Font size
Worksheets
Answer Key(0, 2)
The U-shaped graph of a quadratic function
(4, -6)
-∞ < x < ∞
-6 ≤ y < ∞
All of the above
y = 4x2 - 7x + 11
This Grade 8 worksheet uses 20 multiple-choice questions to assess how students interpret quadratic-function graphs and related vocabulary. Students identify vertices, y- and x-intercepts, roots or zeros, axes of symmetry, domain, range, maximum or minimum values, and the number of solutions, while also recognizing a parabola and standard quadratic form.
Introduce the worksheet by modeling one parabola and labeling its vertex, axis of symmetry, intercepts, domain, and range. Then have students explain why roots, zeros, solutions, and x-intercepts can describe the same graph feature before completing the multiple-choice items. Use the graph-based questions as discussion prompts, asking students to justify each coordinate or interval from the graph rather than choosing by vocabulary alone.
Watch for students confusing the vertex with the y-intercept or selecting an x-intercept when a question asks for the vertex. Students may also reverse domain and range, report only the x-values instead of the full intercept coordinates, or treat roots, zeros, and solutions as different quantities. For the graph questions, check that students use the direction of the parabola to determine whether the graph has a minimum or maximum and count its x-axis intersections accurately.
The worksheet is available as a printable PDF and as a digital quiz on Wayground, and it includes a complete answer key for all 20 multiple-choice questions. Printable submissions can be graded by scanning student work with the Wayground for Teachers app. The printable option can also support schools that are reducing screen time while students practice graph attributes.
Use the worksheet’s Advanced Settings to adjust font spacing or font size so the coordinate choices, graph labels, and multiple-choice options are easier to read. You can also apply a dyslexia-friendly font or translate the quadratic-functions worksheet into another language when appropriate for your learners.
Wayground offers a comprehensive collection of free printable worksheets and practice problems across all subjects, with downloadable PDFs and answer keys to help students master essential skills and concepts. Browse more resources at https://wayground.com/en-us/worksheets.