Exponential/Logarithmic Functions is a free printable mathematics worksheet for students in Grades 9–11. It contains 20 questions—19 multiple-choice items and one multiple-select item—focused on interpreting exponential and logarithmic functions through equations, graphs, and tables. Students identify y- and x-intercepts, determine growth or decay, evaluate logarithms, and recognize horizontal and vertical transformations.
The worksheet also asks students to find domains, ranges, and asymptotes; select equations represented by tables; and match functions to their graphs. These items help students connect algebraic forms with key graphical features and apply parent-function knowledge when analyzing transformed functions. A complete answer key is included, making this resource useful for guided practice, independent review, or assessment. It is available as a printable PDF for Grade 9 to Grade 11 mathematics instruction.
Worksheet settings
Font size
S
M
L
XL
Worksheets
Exponential/Logarithmic Functions
Total questions: 20
Name
Class
Date
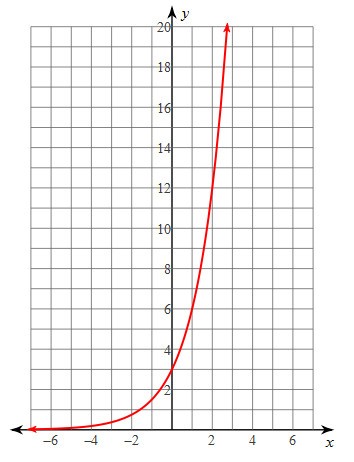
1.
What is the y-intercept of the function?
a)
2
b)
3
c)
1
d)
-2
2.
Which graph best represents the following logarithmic function? y=log4x
a)
b)
c)
d)
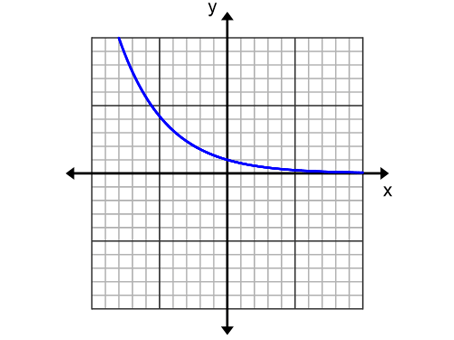
3.
Is this exponential growth or decay?
a)
Growth
b)
Decay
4.
Using the parent function y=log3x what would the graph of y=log3(x+5) look like?
a)
Horizontal shift left 5 units
b)
Horizontal shift right 5 units
c)
Vertical shift up 5 units
d)
Vertical shift down 5 units
5.
Given y=3x determine the asymptote
a)
(0,1)
b)
(0,3)
c)
x=0
d)
y=0
6.
log525 = ?
a)
2
b)
5
c)
125
d)
10
7.
What transformations occur in the following function?
a)
right 3, up 2
b)
left 3, up 2
c)
left 3, down 2
d)
right 3, down 2
8.
What is the range?
a)
(-∞, ∞)
b)
(0, ∞)
c)
[1, ∞)
d)
(1, ∞)
9.
Which of the following is an increasing exponential function whose y-intercept is 50?
a)
y = 50(.05)x
b)
y = 50x - 4
c)
y = (2)x + 50
d)
y = 50(1.4)x
10.
What is the domain?
a)
(-∞, ∞)
b)
(0, ∞)
c)
[1, ∞)
d)
(1, ∞)
11.
What is the domain and range of the function y=2x ? Use the graph to help!
a)
Domain: −∞<x<∞ Range: y>0
b)
Domain: −∞<x<∞ Range: y>1
c)
Domain: −2<x<∞ Range: y>0
d)
Domain: −∞<x<∞ Range: y>0
12.
Where is the asymptote?
a)
x = 1
b)
y = 1
c)
x = -1
d)
y = -1
13.
Which equation is represented by the table?
a)
y = 40(2)x
b)
y = 40(1/2)x
c)
y = 40 - 2x
d)
y = 40 - 1/2x
14.
What is the x-intercept of log7(x)?
a)
(2, 0)
b)
(-1, 0)
c)
(0, 1)
d)
(1, 0)
15.
Which table represents the following equation?
a)
b)
c)
d)
16.
Rewrite 34 = 81 in logarithmic form.
a)
log34 = 81
b)
log813 = 4
c)
log381 = 4
d)
log481 = 3
17.
Identify which functions are exponential.
a)
f(x) = 2x - 5
b)
g(x) = 3x
c)
k(x) = 3x4 - 6x + 9
d)
k(x)=3⋅(21)x
18.
Find the corresponding graph of log3(x−1)+4
a)
b)
c)
d)
19.
Evaluate the exponential function
f(x) = 3x ; x = - 2
a)
-81
b)
-9
c)
1/9
d)
-1/81
20.
Find the corresponding graph of log3(x)−2
a)
b)
c)
d)
Answer Key
Exponential/Logarithmic Functions
Total questions: 20
1.
b) 3
2.
a)
3.
b) Decay
4.
a)
Horizontal shift left 5 units
5.
d) y=0
6.
a) 2
7.
a) right 3, up 2
8.
a) (-∞, ∞)
9.
d) y = 50(1.4)x
10.
d) (1, ∞)
11.
a) Domain: −∞<x<∞ Range: y>0
12.
a) x = 1
13.
b)
y = 40(1/2)x
14.
d)
(1, 0)
15.
c)
16.
c) log381 = 4
17.
b)
g(x) = 3x
, d)
k(x)=3⋅(21)x
18.
a)
19.
c)
1/9
20.
a)
140 %
Browse by subjects
Browse by grades
Browse by format
FAQs
What does this exponential and logarithmic functions worksheet cover?
This worksheet uses 19 multiple-choice questions and one multiple-select question to assess how students analyze exponential and logarithmic functions. Students identify intercepts, domains, ranges, and asymptotes; classify exponential growth or decay; evaluate logarithms; recognize transformations; and select equations represented by graphs or tables. Completing these varied items builds connections between a function’s equation, table, and graphical features.
How can I use this worksheet to teach exponential and logarithmic functions?
Introduce the parent exponential and logarithmic functions before assigning the worksheet, then model how a base, shift, or reflection changes a graph. Have students explain their choices for the transformation, asymptote, domain, or range items rather than selecting answers silently. Afterward, use the graph-and-table questions to discuss how students can verify an equation from more than one representation.
What mistakes should I watch for when students complete this worksheet?
Students may confuse x-intercepts with y-intercepts, or identify an asymptote by its coordinate instead of its equation, such as x = 1 or y = 0. They may also reverse left and right shifts, confuse exponential growth with decay by overlooking the base, or select an incorrect domain or range for a logarithmic graph. Check that students use the graph, table, and equation together when answering representation questions.
How do I assign and grade this exponential and logarithmic functions worksheet?
Wayground provides this worksheet as a printable PDF and as a digital quiz, and it includes a complete answer key for all 20 questions. You can grade printable submissions by scanning student work with the Wayground for Teachers app, or review responses through the digital quiz.
How can I differentiate this worksheet for my students?
For the graph, table, and equation items on this worksheet, use Advanced Settings to adjust font spacing or font size for easier visual tracking. You can also apply a dyslexia-friendly font or translate the worksheet into another language when those options support students’ access to the function representations and answer choices.
Where can I find more worksheets like this on Wayground?
Wayground offers a comprehensive collection of free printable worksheets and practice problems across subjects, with downloadable PDFs and answer keys to support mastery of essential skills and concepts. Browse more resources at https://wayground.com/en-us/worksheets.


 Worksheets