

Wayground
Trig Modeling - Printable Math Worksheets 9th - 12th Grade - Wayground

Trig Modeling

Josh Rice

Created by Josh Rice

10 questions

9th - 12th Grade

Math

Updated May 2025

Trig Modeling is a Grade 9–12 mathematics worksheet focused on using sinusoidal functions to represent periodic situations and interpret their key features. Across 10 questions—9 multiple-choice items and 1 fill-in-the-blank item—students determine amplitude, period, range, midline-related values, and model parameters from functions, graphs, and real-world contexts. Students also evaluate sinusoidal models for blood pressure and seasonal temperature, construct a temperature function from maximum and minimum values, and analyze rollercoaster height using the form h = Asin(Bd) + C. These tasks connect graphical and algebraic representations while applying trigonometric modeling to circular motion, daily cycles, and changing measurements. This free printable worksheet includes a complete answer key, making it useful for guided practice, independent work, or review before an assessment.

Worksheet settings

Font size

S
M
L
XL
WaygroundWorksheets

Trig Modeling

Total questions: 10

Name
Class
Date
1.

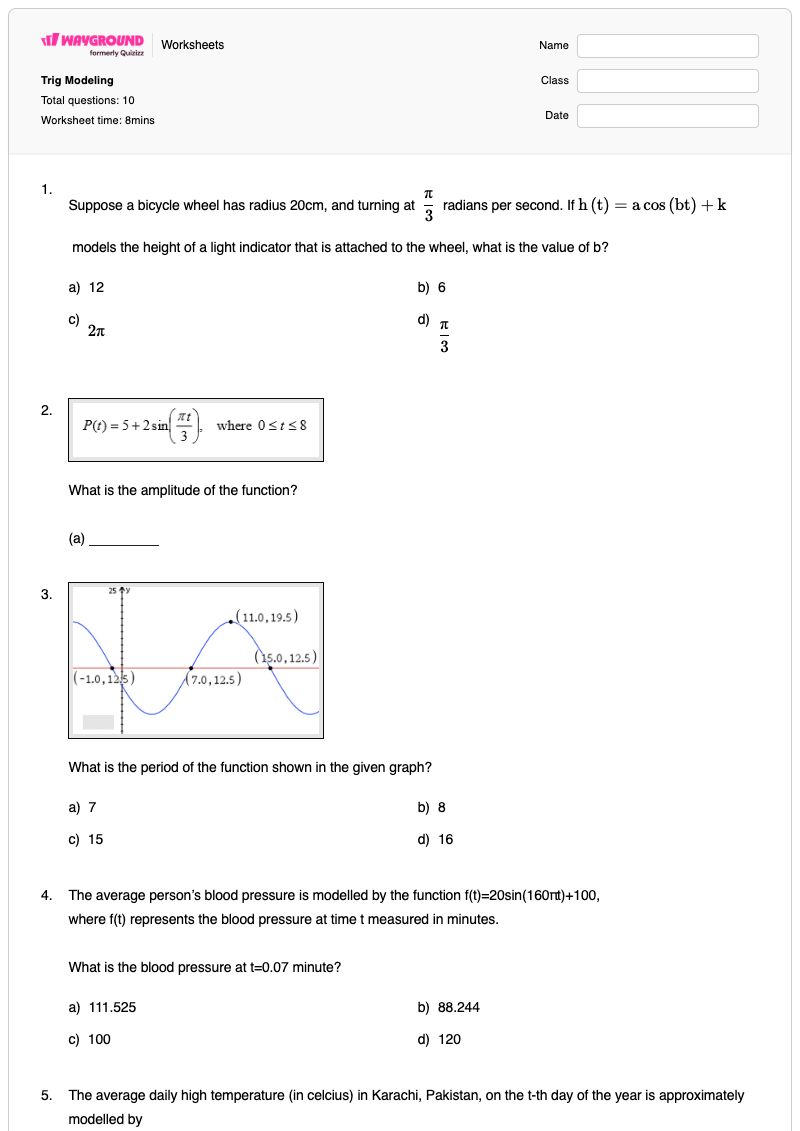
Suppose a bicycle wheel has radius 20cm, and turning at  π3\frac{\pi}{3}  radians per second. If h(t)=acos⁡(bt)+kh\left(t\right)=a\cos\left(bt\right)+k  models the height of a light indicator that is attached to the wheel, what is the value of b?

a)

12

b)

6

c)

2π2\pi  

d)

π3\frac{\pi}{3}  

2.
What is the amplitude of the function?

What is the amplitude of the function?

(a)  

3.
What is the period of the function shown in the given graph?

What is the period of the function shown in the given graph?

a)

7

b)

8

c)

15

d)

16

4.

The average person’s blood pressure is modelled by the function f(t)=20sin(160πt)+100,

where f(t) represents the blood pressure at time t measured in minutes.


What is the blood pressure at t=0.07 minute?

a)

111.525

b)

88.244

c)

100

d)

120

5.

The average daily high temperature (in celcius) in Karachi, Pakistan, on the t-th day of the year is approximately modelled by
T(t)=29−5cos⁡(2π(t−12)365)T\left(t\right)=29-5\cos\left(\frac{2\pi\left(t-12\right)}{365}\right) .  

Find the highest average daily highs in Karachi. Give exact answer.

a)

-5

b)

24

c)

29

d)

34

6.
The daily temperature in the month of March in a certain city varies from a low of 24°F to a high of 40°F. The temperature…

The daily temperature in the month of March in a certain city varies from a low of 24°F to a high of 40°F. The temperature reaches the freezing point 32°F at noon and midnight.

Find a sinusoidal function to model daily temperature. Let t=0 correspond to noon.

a)

y=8cos⁡(π12x)+32y=8\cos\left(\frac{\pi}{12}x\right)+32

b)

y=8sin⁡(π12x)+32y=8\sin\left(\frac{\pi}{12}x\right)+32

c)

y=8sin⁡(π6x)+32y=8\sin\left(\frac{\pi}{6}x\right)+32

d)

y=−8cos⁡(π6x)+32y=-8\cos\left(\frac{\pi}{6}x\right)+32

7.
Find/calculate the amplitude.

Find/calculate the amplitude.

a)

Amplitude = 2.375

b)

Amplitude = 4π/3

c)

Amplitude = 2.625

8.
Find/calculate the range.

Find/calculate the range.

a)

Range = [-0.25, 2.375]

b)

Range = [0.25, 5]

c)

Range = [-5, -0.25]

d)

Range = [-2.375, 0.25]

9.
A section of a rollercoaster is in the shape of a sinusoidal curve shown below. It has a maximum height above the ground of…

A section of a rollercoaster is in the shape of a sinusoidal curve shown below. It has a maximum height above the ground of 43 feet and a minimum of 3 feet. The equation can be written in the form h = Asin(Bd) + C:


What is the value of A?

a)

-20

b)

100

c)

-40

d)

20

10.
A section of a rollercoaster is in the shape of a sinusoidal curve shown below. It has a maximum height above the ground of…

A section of a rollercoaster is in the shape of a sinusoidal curve shown below. It has a maximum height above the ground of 43 feet and a minimum of 3 feet. The equation can be written in the form h = Asin(Bd) + C:


What is the value of C?

a)

23

b)

20

c)

40

d)

43

WaygroundAnswer Key

Trig Modeling

Total questions: 10

1.
d)

π3\frac{\pi}{3}  

2.
2, two
3.
d)

16

4.
b)

88.244

5.
d)

34

6.
b)

y=8sin⁡(π12x)+32y=8\sin\left(\frac{\pi}{12}x\right)+32

7.
a)

Amplitude = 2.375

8.
b)

Range = [0.25, 5]

9.
a)

-20

10.
a)

23

FAQs

What does the Trig Modeling worksheet cover?

This worksheet helps students interpret and construct sinusoidal models by finding amplitude, period, range, and model parameters from equations, graphs, and real-world situations. Its 9 multiple-choice questions and 1 fill-in-the-blank question include applications involving a rotating bicycle wheel, blood pressure, temperature, and rollercoaster height.

How can I use this worksheet to teach sinusoidal modeling?

Introduce amplitude, period, and range with a graph, then have students connect each feature to the maximum, minimum, and repeating behavior in the worksheet’s temperature and rollercoaster contexts. Use the blood-pressure and seasonal-temperature items to model substitution and interpretation, and discuss how the high and low temperatures determine the sinusoidal function’s amplitude and midline.

What mistakes should I watch for when students complete this trig modeling worksheet?

Students may confuse amplitude with the maximum value, especially in the questions asking for amplitude or the rollercoaster parameter A. They may also calculate the range incorrectly by overlooking the function’s vertical shift, or use the wrong period when reading the graph. In the temperature-modeling items, check that students use the given maximum and minimum values and correctly identify the midline.

How do I assign and grade this Trig Modeling worksheet?

The worksheet is available as a printable PDF and as a digital quiz on Wayground, with a complete answer key for all 10 items. You can grade printable submissions by scanning student work with the Wayground for Teachers app, or use the digital quiz to collect responses online. The printable format can also support schools that are reducing screen time.

How can I differentiate this sinusoidal modeling worksheet for my students?

In the worksheet’s Advanced Settings, adjust font spacing or font size to make the equations, answer choices, and graph-based items easier to read. You can also apply a dyslexia-friendly font or translate the worksheet into another language to support access to the sinusoidal modeling tasks.

Where can I find more worksheets like this on Wayground?

Wayground offers a broad collection of free printable worksheets and practice problems across subjects, with downloadable PDFs and answer keys to help students master essential skills and concepts. Browse more resources at https://wayground.com/en-us/worksheets.