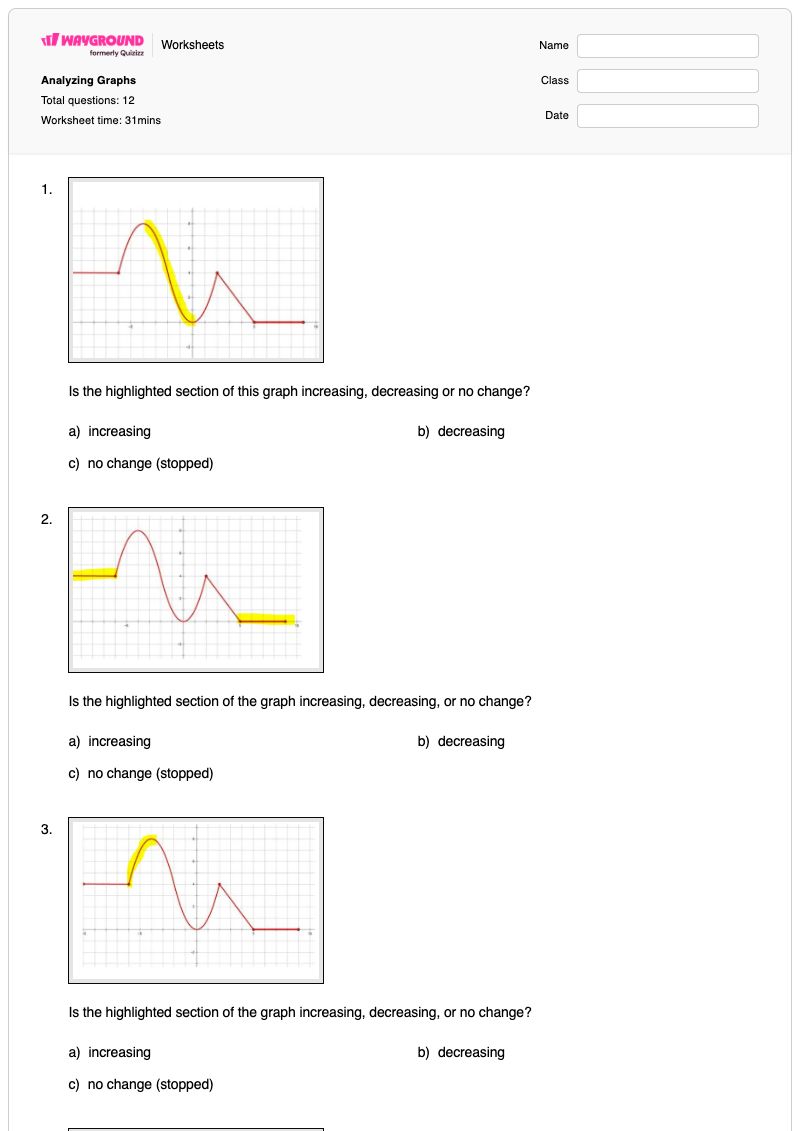
Analyzing Graphs is a Grade 8 mathematics worksheet that builds students’ ability to read and interpret changing quantities on graphs. The 11 multiple-choice questions ask students to identify whether highlighted sections are increasing, decreasing, or showing no change; locate a constant section; and interpret distance-time graphs to determine elapsed travel time, total distance, greatest speed interval, stopping time, and distance traveled after a given time. The worksheet also includes one open-ended response item.
This free printable worksheet gives students focused practice connecting graph features with real-world movement scenarios, including riding to school and walking to a grocery store. It can support independent practice, guided review, or a quick check of students’ graph-reading skills after instruction. A complete answer key is included so teachers can review students’ choices and identify whether errors involve reading axes, recognizing horizontal sections, comparing intervals, or extracting values at specific times.
Worksheet settings
Font size
S
M
L
XL
Worksheets
Analyzing Graphs
Total questions: 12
Name
Class
Date
1.
Is the highlighted section of this graph increasing, decreasing or no change?
a)
increasing
b)
decreasing
c)
no change (stopped)
2.
Is the highlighted section of the graph increasing, decreasing, or no change?
a)
increasing
b)
decreasing
c)
no change (stopped)
3.
Is the highlighted section of the graph increasing, decreasing, or no change?
a)
increasing
b)
decreasing
c)
no change (stopped)
4.
Is the highlighted section of the graph increasing, decreasing or no change?
a)
increasing
b)
decreasing
c)
no change (stopped)
5.
Is the highlighted section of the graph increasing, decreasing or no change?
a)
increasing
b)
decreasing
c)
no change
6.
Which part of the following graph is there no change (stopped)?
a)
part A
b)
Part B
c)
Part C
d)
Part D
7.
How long did it take Xavier to ride his bike to school?
a)
2 minutes
b)
5 minutes
c)
8 minutes
8.
What was the total distance it took Xavier to travel to school?
a)
0.7 miles
b)
0.5 miles
c)
0.4 miles
9.
During which time interval was Xavier riding his scooter at the greatest speed?
a)
between minute 1and minute 2 of the ride
b)
between minutes 2 and minute 4 of the ride
c)
between minute 4 and minute 5 of the ride
d)
between minutes 5 and minute 8 of the ride
10.
This graph shows the travel time of someone walking to the grocery store and back. At what time did this person stop to take a break?
a)
60-80 minutes
b)
0-20 minutes
c)
The person did not stop
d)
80- 120 minutes
11.
How far (in distance) did the person travel after 40 minutes?
a)
4 km
b)
6 km
c)
8 km
d)
10km
12.
What should Ms. Qualters' Tiktok name be?!!
4 lines
Answer Key
Analyzing Graphs
Total questions: 12
1.
b)
decreasing
2.
c)
no change (stopped)
3.
a)
increasing
4.
b)
decreasing
5.
a)
increasing
6.
c)
Part C
7.
c)
8 minutes
8.
a)
0.7 miles
9.
b)
between minutes 2 and minute 4 of the ride
10.
a)
60-80 minutes
11.
b)
6 km
12.
n/a
140 %
Browse by subjects
Browse by grades
Browse by format
FAQs
What does the Analyzing Graphs worksheet cover?
This Grade 8 mathematics worksheet develops graph interpretation through 11 multiple-choice questions and one open-ended response. Students classify highlighted sections as increasing, decreasing, or showing no change, then read distance-time graphs to identify travel duration, total distance, greatest speed interval, stopping time, and distance at a given time.
How can I use this worksheet to teach students to interpret distance-time graphs?
Begin by modeling how to read the direction of a highlighted graph section: upward indicates increasing values, downward indicates decreasing values, and a horizontal section indicates no change. Then use the travel scenarios in this worksheet to discuss how students can compare intervals for speed, locate a stop, and read a distance value at a specified time before assigning the multiple-choice items independently.
What mistakes should I watch for when students complete this graph worksheet?
Watch for students confusing a horizontal section with an increasing or decreasing section, or selecting the wrong labeled part when identifying where no change occurs. In the distance-time questions, students may read the wrong axis, confuse total travel time with distance traveled, choose an interval without comparing its slope, or overlook the flat interval that represents a stop.
How do I assign and grade the Analyzing Graphs worksheet?
On Wayground, this worksheet is available as a printable PDF and as a digital quiz, and it includes a complete answer key for all graph-reading items. Printable submissions can be graded by scanning student work with the Wayground for Teachers app, while the digital quiz can be completed and reviewed online.
How can I differentiate this graph interpretation worksheet for my students?
Use the worksheet’s Advanced Settings to adjust font spacing and font size so the graph questions and answer choices are easier to scan. You can also apply a dyslexia-friendly font or translate the worksheet into another language, depending on students’ needs.
Where can I find more worksheets like this on Wayground?
Wayground offers a comprehensive collection of free printable worksheets and practice problems across all subjects, with downloadable PDFs and answer keys to support mastery of essential skills and concepts. Browse more resources at https://wayground.com/en-us/worksheets.


 Worksheets


