
Wayground
HR Diagrams Practice - Printable Science Worksheets grade 9 - Wayground

HR Diagrams Practice

Molly Turner

Created by Molly Turner

14 questions

9th Grade

Science

Updated May 2026

HR Diagrams Practice is a Grade 9 science worksheet with 14 multiple-choice questions focused on interpreting Hertzsprung-Russell diagrams. Students analyze how stellar temperature and luminosity relate, classify stars such as Betelgeuse, Proxima Centauri’s star, and the Sun, and identify groups including main-sequence stars, giants, supergiants, and white dwarfs. The questions also require students to read temperature trends across the diagram, compare star colors, locate labeled regions, and connect diagram positions with hydrogen fusion, equilibrium between fusion and gravity, stellar age, and the brightest, reddest stars. This free printable worksheet includes a complete answer key for efficient review, independent practice, or assessment of students’ ability to extract information from an H-R diagram.

Worksheet settings

Font size

S
M
L
XL
WaygroundWorksheets

HR Diagrams Practice

Total questions: 14

Name
Class
Date
1.
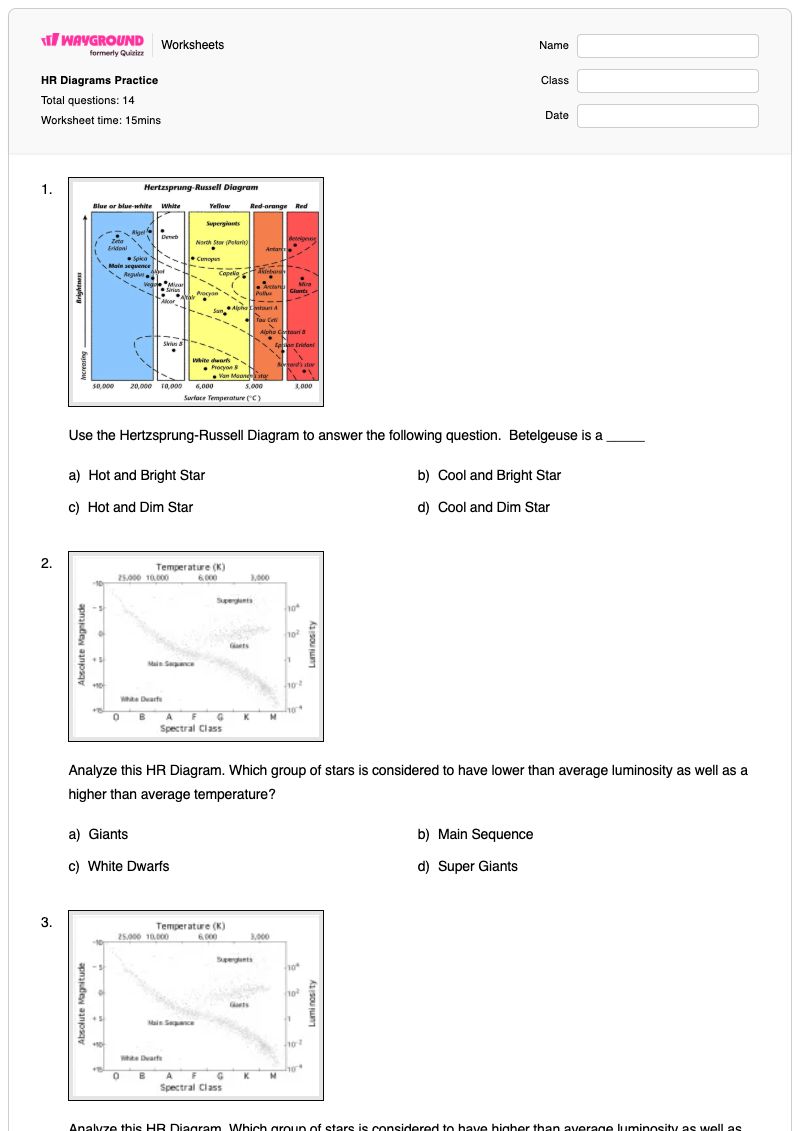
Use the Hertzsprung-Russell Diagram to answer the following question. Betelgeuse is a _____
Use the Hertzsprung-Russell Diagram to answer the following question.  Betelgeuse is a _____
a)
Hot and Bright Star
b)
Cool and Bright Star
c)
Hot and Dim Star
d)
Cool and Dim Star
2.
Analyze this HR Diagram. Which group of stars is considered to have lower than average luminosity as well as a higher than…
Analyze this HR Diagram. Which group of stars is considered to have lower than average luminosity as well as a higher than average temperature?
a)
Giants
b)
Main Sequence
c)
White Dwarfs
d)
Super Giants
3.
Analyze this HR Diagram. Which group of stars is considered to have higher than average luminosity as well as a lower than…
Analyze this HR Diagram. Which group of stars is considered to have higher than average luminosity as well as a lower than average temperature?
a)
Giants
b)
Main Sequence
c)
White Dwarfs
d)
Super Giants
4.
Which of these observations of Proxima Centuri's Star is most likely accurate?
a)
Proxima Centuri's Star is less bright than the sun and has a surface temperature below 3,400 K
b)
Proxima Centuri's Star is less bright than the sun and has a surface temperature above 3,400 K
c)
Proxima Centuri's Star is brighter than the sun and has a surface temperature below 4,000 K
d)
Proxima Centuri's Star is brighter than the sun and has a surface temperature above 4,000 K
5.
In the diagram given, what happens as we move to the left?
a)
Stars Get Larger
b)
Stars get Colder
c)
Stars get hotter
6.
On the H-R diagram, the Sun is a _____.
a)
Main Sequence star
b)
Red Giant
c)
White Dwarf
d)
Blue Giant
7.
As a whole, Giants are considered hotter than White Dwarfs.
a)
True
b)
False
8.
Which star is the coldest?
a)
Yellow Star
b)
Red Star
c)
Orange Star
d)
Blue Star
9.
Which star has the lowest temperature?
a)
A
b)
B
c)
C
d)
D
10.
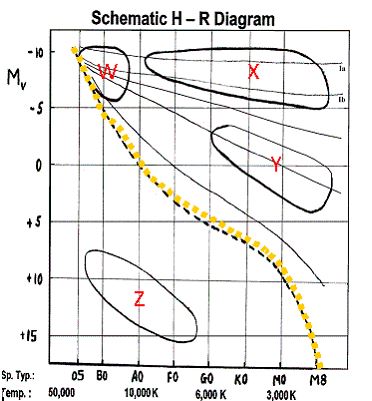
In which region of the H-R Diagram would you be likely to find Blue Giants?
a)
W
b)
X
c)
Y
d)
Z
11.
In which region of the H-R Diagram would you be likely to find the oldest stars?
a)
W
b)
X
c)
Y
d)
Z
12.
In which region of the H-R Diagram would you be likely to find stars fusing hydrogen to make helium in their cores?
a)
W
b)
X
c)
Y
d)
The orange dashed line
13.
In which region of the H-R Diagram would you be likely to find stars that are in equilibrium between fusion and gravity?

In which region of the H-R Diagram would you be likely to find stars that are in equilibrium between fusion and gravity?

a)
W
b)
X
c)
Y
d)
The orange dashed line
14.
In which region of the H-R Diagram would you be likely to find the brightest, reddest stars?
a)
W
b)
X
c)
Y
d)
The orange dashed line
WaygroundAnswer Key

HR Diagrams Practice

Total questions: 14

1.
b) Cool and Bright Star
2.
c) White Dwarfs
3.
d) Super Giants
4.
a) Proxima Centuri's Star is less bright than the sun and has a surface temperature below 3,400 K
5.
c) Stars get hotter
6.
a) Main Sequence star
7.
b) False
8.
b) Red Star
9.
c) C
10.
a) W
11.
d) Z
12.
d) The orange dashed line
13.
d) The orange dashed line
14.
b) X

FAQs

What does the HR Diagrams Practice worksheet cover?

This Grade 9 science worksheet uses 14 multiple-choice questions to build students’ ability to interpret Hertzsprung-Russell diagrams. Students compare stellar temperature and luminosity, classify stars and stellar groups, read temperature changes across the diagram, and identify regions associated with main-sequence fusion, stellar equilibrium, star age, and brightness.

How can I use this worksheet to teach students to interpret an H-R diagram?

Introduce the diagram by having students identify what the horizontal direction shows about temperature, then guide them to compare temperature and luminosity together rather than reading either variable in isolation. Use the questions about the Sun, Betelgeuse, Proxima Centauri’s star, and the labeled regions W–Z as a sequence from locating information to classifying stellar groups and explaining what diagram regions represent.

What mistakes should I watch for when students complete this H-R diagram worksheet?

Watch for students assuming that moving left means stars become colder; this worksheet tests that stars become hotter toward the left. Students may also confuse temperature with luminosity, misidentify the coldest red star, or select giants and white dwarfs based on only one characteristic instead of comparing both properties. Check that they distinguish the labeled regions from the orange dashed line when identifying main-sequence fusion and equilibrium.

How do I assign and grade this HR Diagrams Practice worksheet?

The worksheet is available as a printable PDF and as a digital quiz on Wayground, and it includes a complete answer key for all 14 multiple-choice questions. For printable submissions, you can scan student work with the Wayground for Teachers app to support grading.

How can I differentiate this H-R diagram worksheet for my students?

Use the worksheet’s Advanced Settings to increase font size or spacing so the multiple-choice options and diagram-region labels are easier to read. You can also apply a dyslexia-friendly font or translate the worksheet into another language while students work with the H-R diagram questions.

Where can I find more worksheets like this on Wayground?

Wayground offers a broad collection of free printable worksheets and practice problems across subjects, with downloadable PDFs and answer keys to help students master essential skills and concepts. Browse more resources at https://wayground.com/en-us/worksheets.