Key Features of Graphs of Functions Part 2 is a free printable mathematics worksheet for Grades 9–10 that builds skill in interpreting graphs of functions. Students complete 16 questions—14 multiple choice and 2 multiple select—about identifying intervals where a graph is constant, increasing, or decreasing; interpreting time and velocity graphs; locating relative maxima and minima; distinguishing relative from absolute extrema; and finding polynomial zeros from x-axis intersections.
The worksheet asks students to select intervals, coordinates, graph features, and all applicable answers, helping them connect visual features of a graph to precise mathematical descriptions. It includes examples involving travel and velocity as well as polynomial graphs, giving students practice reading both contextual and algebraic representations. Use it for independent practice, review, or a quick check of Grade 9–10 understanding. A complete answer key is included with this free printable worksheet.
Worksheet settings
Font size
S
M
L
XL
Worksheets
Key Features of Graphs of Functions Part 2
Total questions: 16
Name
Class
Date
1.
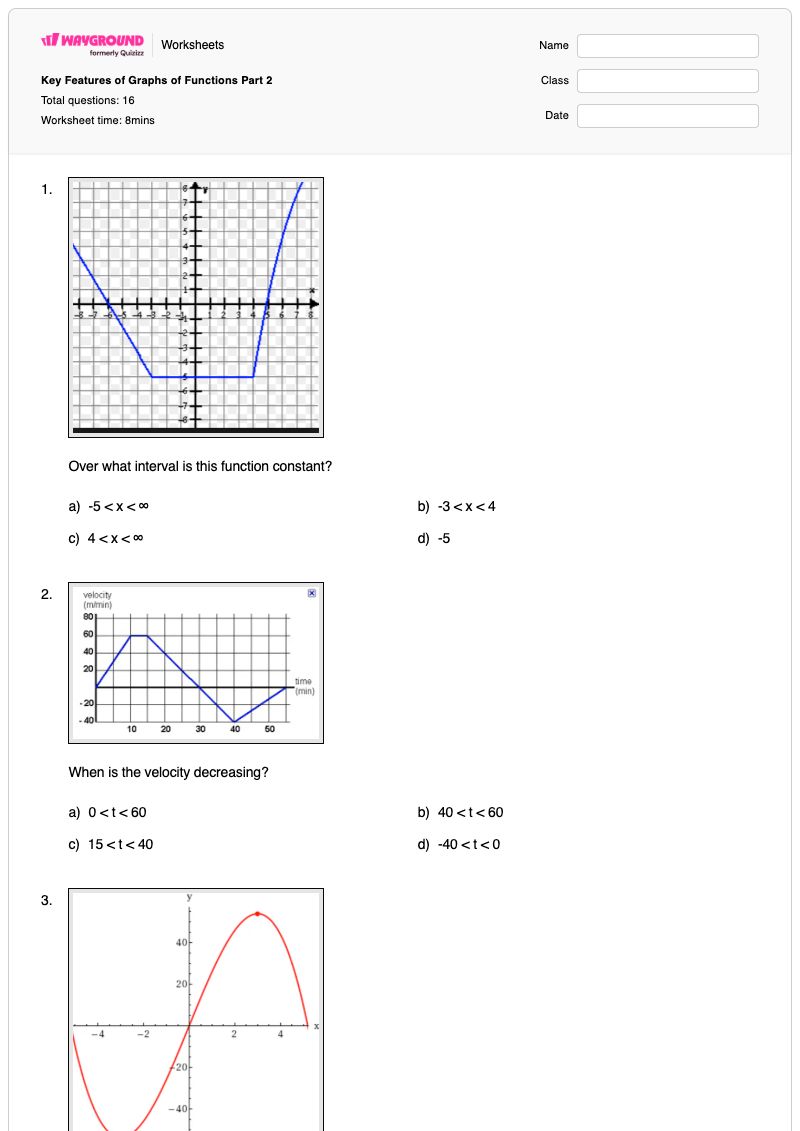
Over what interval is this function constant?
a)
-5 < x < ∞
b)
-3 < x < 4
c)
4 < x < ∞
d)
-5
2.
When is the velocity decreasing?
a)
0 < t < 60
b)
40 < t < 60
c)
15 < t < 40
d)
-40 < t < 0
3.
When is this function increasing?
a)
-2.5 < x < 2.5
b)
0 < x < 5
c)
0 < x < 55
d)
-5 < x < 0
4.
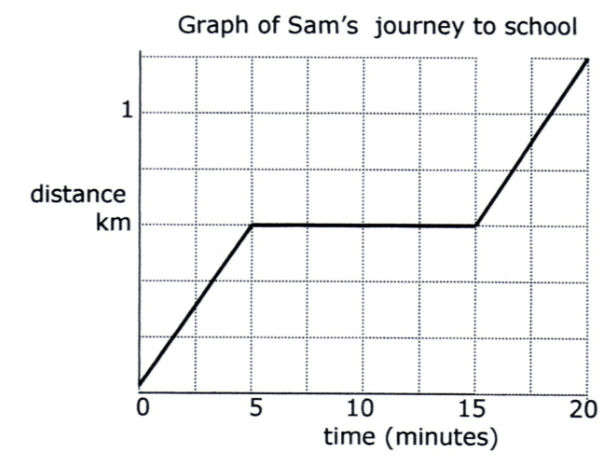
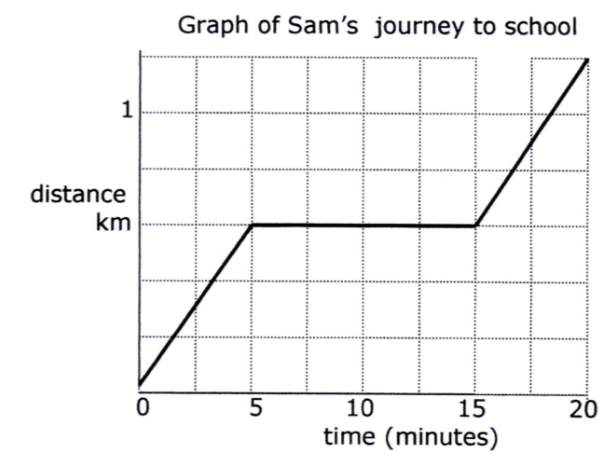
How long did it take Sam to get to school?
a)
5 minutes
b)
20 minutes
c)
1.25 km
d)
1.25 minutes
5.
How long did Sam sit on the bench and wait for the bus?
a)
5 min
b)
10 min
c)
15 min
d)
20 min
6.
Over which interval of time is this person returning home?
a)
8:00 < x < 9:00
b)
9:00 < x < 9:30
c)
9:30 < x < 11:00
d)
12:00 < x < 13:00
7.
State the point that you identify the relative maximum on the graph?
a)
(–2, 0)
b)
(–1, 4)
c)
(1, 0)
d)
(3, 20)
8.
State the point where you identify the relative minimum on the graph?
a)
(–2, 0)
b)
(–1, 4)
c)
(1, 0)
d)
(3, 20)
9.
On the interval of (0, 2) what is happening?
a)
the graph is decreasing
b)
the graph is increasing
c)
the graph remains constant
10.
Which points show the relative minimum on the graph?
a)
(0, 0)
b)
(–2, 16)
c)
(2, 16)
d)
(–2.5, 12)
11.
How would you describe the point at (0,6)?
a)
Relative Minimum
b)
Absolute Minimum
c)
Relative Maximum
d)
Absolute Maximum
12.
What are the zeros for the given polynomial? (Check all that apply)
HInt: where does the graph cross the X-axis
a)
-4
b)
-3
c)
-2
d)
-1
e)
2
13.
How many Intervals of Increase occur in this graph?
a)
1
b)
2
c)
3
d)
4
14.
For the given polynomial graph, what is the relative maximum value?
a)
(-1, -2)
b)
(-3, 8)
c)
(1, 2)
d)
(3, -8)
15.
What are the Relative Maximums on this graph?
a)
Point A, B and E
b)
Point A, C, and E
c)
Point B, D, and F
d)
Point A, C, D, and F
16.
What is the Absolute Maximum?
a)
Point A
b)
Point C
c)
Point E
d)
Point G
Answer Key
Key Features of Graphs of Functions Part 2
Total questions: 16
1.
b) -3 < x < 4
2.
c) 15 < t < 40
3.
a) -2.5 < x < 2.5
4.
b) 20 minutes
5.
b) 10 min
6.
d) 12:00 < x < 13:00
7.
b)
(–1, 4)
8.
c)
(1, 0)
9.
b)
the graph is increasing
10.
a)
(0, 0)
11.
a)
Relative Minimum
12.
e)
2
, d)
-1
, a)
-4
13.
b)
2
14.
c)
(1, 2)
15.
b)
Point A, C, and E
16.
d)
Point G
140 %
Browse by subjects
Browse by grades
Browse by format
FAQs
What does the Key Features of Graphs of Functions Part 2 worksheet cover?
This worksheet builds graph-interpretation skills through 14 multiple-choice and 2 multiple-select questions. Students identify intervals where functions are constant, increasing, or decreasing; read time and velocity graphs; locate relative maxima and minima; distinguish relative from absolute extrema; and identify polynomial zeros where a graph crosses the x-axis.
How can I use this worksheet to teach students to interpret key features of function graphs?
Model how to scan a graph from left to right and connect horizontal, rising, and falling sections to constant, increasing, and decreasing intervals. Then have students justify selected coordinates for relative extrema and use the x-axis as a reference when finding polynomial zeros. The travel-time and velocity items can provide a concrete bridge before students work with polynomial graphs.
What mistakes should I watch for when students complete this graph features worksheet?
Students may choose a graph endpoint or an isolated x-value instead of the full interval over which the function changes or remains constant. They may also confuse a relative maximum or minimum with an absolute one, report only the y-value when a coordinate point is requested, or miss one of several correct choices in the multiple-select questions about minima and zeros. For polynomial zeros, check that students select x-intercepts rather than points that are merely near the x-axis.
How do I assign and grade this worksheet?
The worksheet is available as a printable PDF and as a digital quiz on Wayground, with a complete answer key for all graph-interpretation questions. Printable submissions can be graded by scanning student work with the Wayground for Teachers app.
How can I differentiate this graph features worksheet for my students?
In the worksheet’s Advanced Settings, adjust font spacing or font size to give students more room to read graph-based prompts and answer choices. You can also apply a dyslexia-friendly font or translate the worksheet into another language while keeping the interval, extrema, and polynomial-zero questions in the same format.
Where can I find more worksheets like this on Wayground?
Wayground offers a comprehensive collection of free printable worksheets and practice problems across subjects, with downloadable PDFs and answer keys to support essential skills and concepts. Browse more resources at https://wayground.com/en-us/worksheets.

 Worksheets