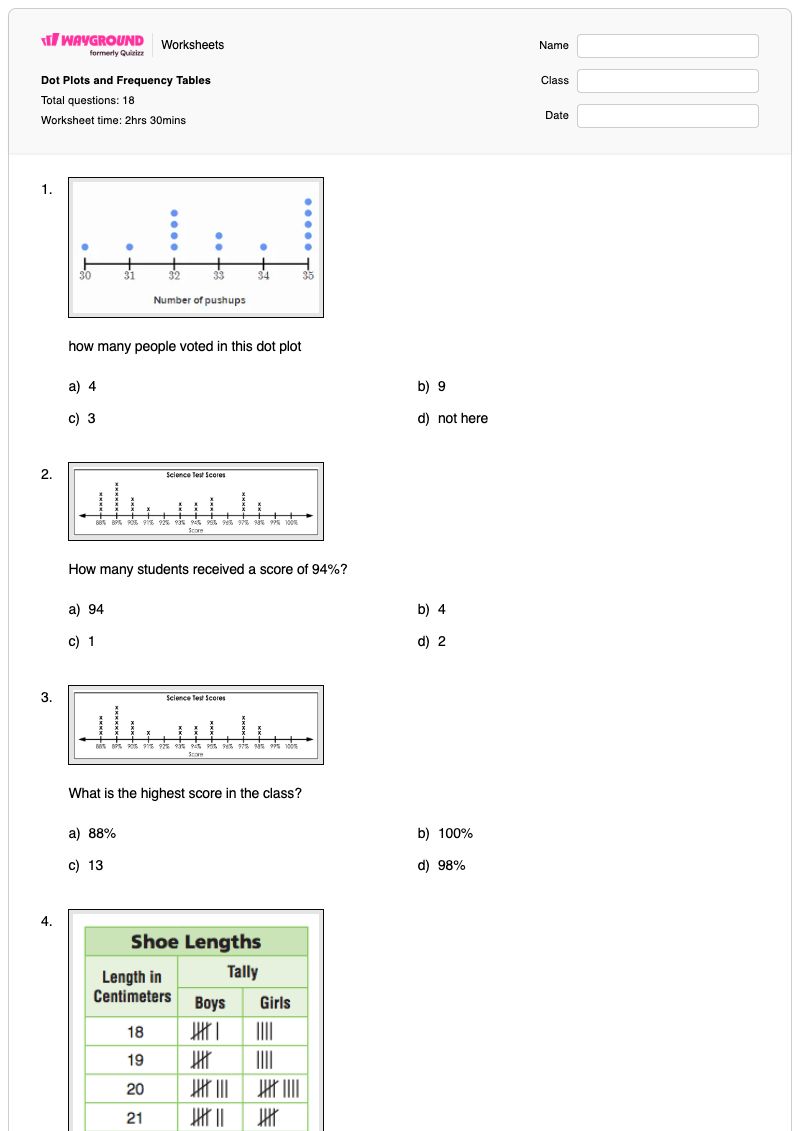

Dot Plots and Frequency Tables is a Grade 6 math worksheet that helps students interpret data displays and identify statistical questions. Across 18 multiple-choice items, students count data points, determine frequencies, find highest values, compare categories, combine responses, and use dot plots to answer questions about scores, shoe lengths, pets, and survey participation.
The worksheet also asks students to distinguish statistical questions from non-statistical questions by recognizing when a question expects a variety of answers across a group rather than one person's answer. Teachers can use this free printable worksheet with an answer key for independent practice, review, or a quick assessment of students' ability to read data and classify questions.
Worksheet settings
Font size
S
M
L
XL
Worksheets
Dot Plots and Frequency Tables
Total questions: 18
Name
Class
Date
1.
how many people voted in this dot plot
a)
4
b)
9
c)
3
d)
not here
2.
How many students received a score of 94%?
a)
94
b)
4
c)
1
d)
2
3.
What is the highest score in the class?
a)
88%
b)
100%
c)
13
d)
98%
4.
How many boys have shoes that are 18 centimeters long?
a)
6
b)
10
c)
2
d)
5
5.
How many children participated in the survey?
a)
34
b)
30
c)
32
d)
6
6.
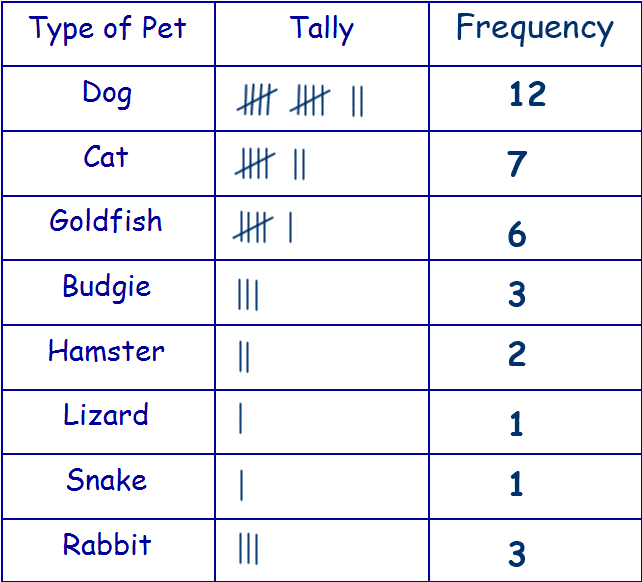
How many students voted for fish or cat?
a)
10
b)
6
c)
4
d)
2
7.
How many girls have shoes that are 18 centimeters long?
a)
6
b)
10
c)
4
d)
5
8.
How many girls have shoes that are 22 centimeters long?
a)
6
b)
7
c)
5
9.
Which is the most popular pet?
a)
Dog
b)
Cat
c)
Hamster
d)
Rabbit
10.
Which pet was chosen by 6 people?
a)
Cat
b)
Goldfish
c)
Hamster
d)
Snake
11.
What is a requirement of a statistical question?
a)
one set answer
b)
a variety of answers
12.
Choose the statistical question:
a)
How many sixth graders ate breakfast on Monday?
b)
How many sixth graders eat breakfast each school day?
13.
Choose the statistical question:
a)
What time did you wake up this morning?
b)
What time do sixth graders wake up each morning during the school week?
14.
Statistical questions have _____ possible answers.
a)
zero
b)
one
c)
only two
d)
two or more
15.
How many cats does Amy own?
a)
statistical
b)
non-statistical
16.
Statistical or Not?
How many teachers work at Clinton School District?
a)
Not Statistical
b)
Statistical
17.
Statistical or Not?
How many years experience do teachers at Clinton School District have?
a)
Not Statistical
b)
Statistical
18.
Statistical or Not?
What was the highest score on the NWEA MAP Math Test this Spring?
a)
Not Statistical
b)
Statistical
Answer Key
Dot Plots and Frequency Tables
Total questions: 18
1.
d)
not here
2.
d) 2
3.
d) 98%
4.
a)
6
5.
b) 30
6.
a)
10
7.
c)
4
8.
b)
7
9.
a)
Dog
10.
b)
Goldfish
11.
b)
a variety of answers
12.
b)
How many sixth graders eat breakfast each school day?
13.
b)
What time do sixth graders wake up each morning during the school week?
14.
d)
two or more
15.
b)
non-statistical
16.
a)
Not Statistical
17.
b)
Statistical
18.
a)
Not Statistical
140 %
Browse by subjects
Browse by grades
Browse by format
FAQs
What does the Dot Plots and Frequency Tables worksheet cover?
This Grade 6 math worksheet uses 18 multiple-choice questions to assess how students read dot plots and frequency-table data. Students count observations, identify frequencies and maximum values, compare pet and shoe-length categories, combine groups, and distinguish statistical questions from questions with a single answer.
How can I use this worksheet to teach students about dot plots and statistical questions?
First model how to count each mark in a dot plot and connect the count to a category's frequency, then have students explain how they found totals, highest values, and combined categories. After the data-display practice, discuss why questions about a group over repeated or varied experiences are statistical, while a question about one person's information is not.
What mistakes should I watch for when students complete this worksheet?
Students may report the category label instead of counting its data points, overlook one mark when finding a frequency, or choose the highest frequency when the question asks for the highest data value. They may also add the wrong pet or shoe-length categories and mistake a question about one person, such as Amy, for a statistical question.
How do I assign and grade this Dot Plots and Frequency Tables worksheet?
The worksheet is available as a printable PDF and as a digital quiz on Wayground, and it includes a complete answer key for its 18 multiple-choice questions. For printable submissions, you can grade student work by scanning it with the Wayground for Teachers app.
How does this worksheet help students distinguish statistical from non-statistical questions?
The final set of multiple-choice items asks students to identify whether questions about sixth graders' habits or wake-up times produce varied group data, and to classify a question about how many cats Amy owns as non-statistical. This gives students focused practice recognizing that statistical questions anticipate two or more possible answers rather than one fixed response.
Where can I find more worksheets like this on Wayground?
Wayground offers a broad collection of free printable worksheets and practice problems across all subjects, with downloadable PDFs and answer keys to support mastery of essential skills and concepts. Browse more resources at https://wayground.com/en-us/worksheets.