

Wayground
Math SOL 6.11 - 2016 - Printable Math Worksheets 6th Grade - Wayground

Math SOL 6.11 - 2016

Mr. Kaski

Created by Mr. Kaski

12 questions

6th Grade

Math

Updated Aug 2026

This free printable Grade 6 math worksheet targets mean as the balance point of a data set and includes related median reasoning. Students interpret number lines and line plots, calculate the mean of listed values, identify a data set with a given balance point, and determine an unknown value needed to produce a target mean. The worksheet contains 12 questions: 11 multiple-choice items and 1 multiple-select item. Students also analyze how adding a low value affects a mean, how removing the highest value affects a median, and how replacing a test grade changes an average. These items connect computation with interpretation, helping students explain what happens to measures of center when data values change. The worksheet is designed for Grade 6 math instruction, independent practice, review, or assessment, and includes a complete answer key for efficient checking.

Worksheet settings

Font size

S
M
L
XL
WaygroundWorksheets

Math SOL 6.11 - 2016

Total questions: 12

Name
Class
Date
1.
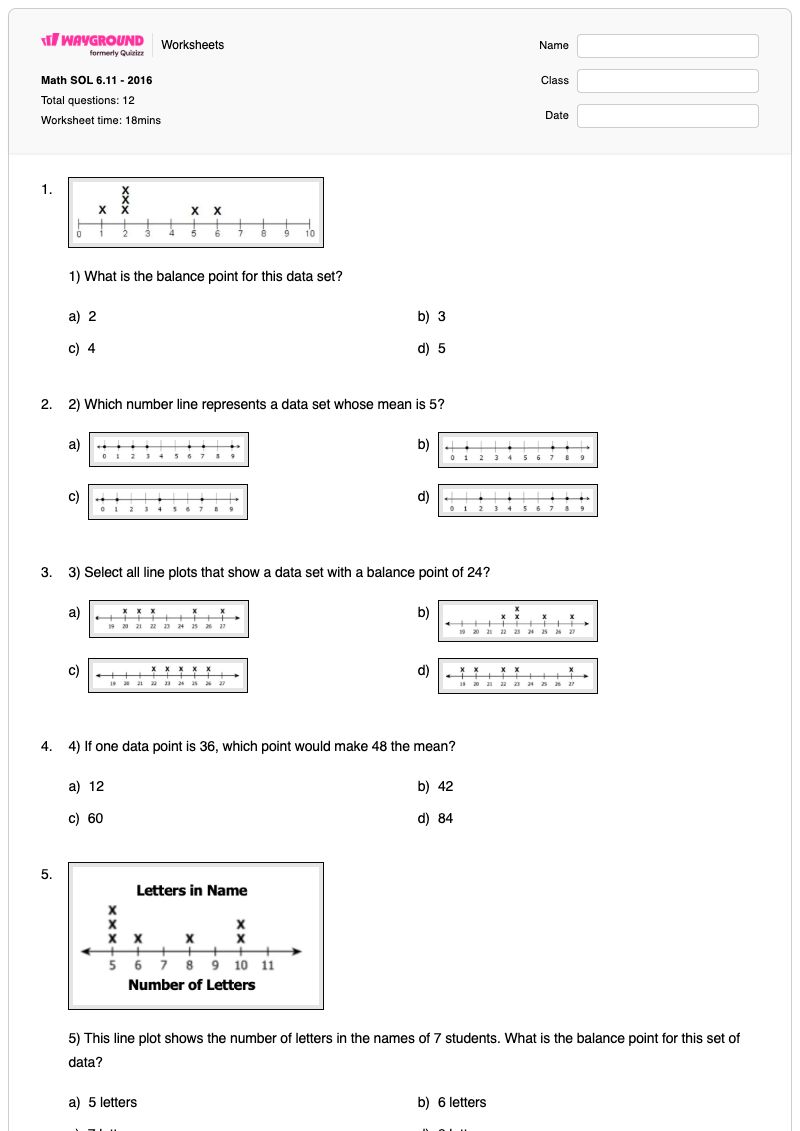
1) What is the balance point for this data set?

1) What is the balance point for this data set?

a)

2

b)

3

c)

4

d)

5

2.

2) Which number line represents a data set whose mean is 5?

a)
2) Which number line represents a data set whose mean is 5?
b)
2) Which number line represents a data set whose mean is 5?
c)
2) Which number line represents a data set whose mean is 5?
d)
2) Which number line represents a data set whose mean is 5?
3.

3) Select all line plots that show a data set with a balance point of 24?

a)
3) Select all line plots that show a data set with a balance point of 24?
b)
3) Select all line plots that show a data set with a balance point of 24?
c)
3) Select all line plots that show a data set with a balance point of 24?
d)
3) Select all line plots that show a data set with a balance point of 24?
4.

4) If one data point is 36, which point would make 48 the mean?

a)

12

b)

42

c)

60

d)

84

5.
5) This line plot shows the number of letters in the names of 7 students. What is the balance point for this set of data?

5) This line plot shows the number of letters in the names of 7 students. What is the balance point for this set of data?

a)

5 letters

b)

6 letters

c)

7 letters

d)

8 letters

6.

6) What is the mean (balance point) for this set of data?

34, 36, 29, 30, 33, 35, 27

a)

30

b)

31

c)

32

d)

33

7.

7) Which line plot shows a set of data with a balance point of 23?

a)
7) Which line plot shows a set of data with a balance point of 23?
b)
7) Which line plot shows a set of data with a balance point of 23?
c)
7) Which line plot shows a set of data with a balance point of 23?
d)
7) Which line plot shows a set of data with a balance point of 23?
8.
9) Each X represents one child's age at a local daycare center. What is the balance point of the age of the children at the…

9) Each X represents one child's age at a local daycare center. What is the balance point of the age of the children at the daycare center?

a)

3

b)

4

c)

5

d)

6

9.
1) The Washington and Lee Eagles baseball team recorded the number of base hits over the first five games. For game six, the…

1) The Washington and Lee Eagles baseball team recorded the number of base hits over the first five games. For game six, the team only had 2 hits. What effect did this game have on the mean for the number of base hits per game?

a)

Game six had no effect on the mean.

b)

The mean number of base hits per game decreased after game six.

c)

The mean number of base hits per game increased after game six.

d)

The team should expect to get 15 hits in game seven.

10.

2) Carlos recorded the high temperatures in July for 6 consecutive days.

{83, 84, 87, 91, 92, 95}

If 95 is removed from the data set, what effect does this have on the median?

a)

The median does not change.

b)

The median changes from 87 to 84.

c)

The median changes from 91 to 87.

d)

The median changes from 89 to 87.

11.
3) A student had four test grades in Mr. Auslender's class. The student decides to re-take test #3. He gets a 95 on his…

3) A student had four test grades in Mr. Auslender's class. The student decides to re-take test #3. He gets a 95 on his re-take. If Mr. Auslender replaces the original test grade with a 95, which statement is true?

a)

The mean changes from an 85 to a 91.

b)

The mean changes from an 85 to an 87.

c)

The change has no effect on the mean.

d)

The mean changes from an 85 to an 80.

12.

4) If two data points are 22 and 26, which data point would make 32 the mean?

a)

16

b)

28

c)

42

d)

48

WaygroundAnswer Key

Math SOL 6.11 - 2016

Total questions: 12

1.
b)

3

2.
b)
3.
b) , c)
4.
c)

60

5.
c)

7 letters

6.
c)

32

7.
a)
8.
b)

4

9.
b)

The mean number of base hits per game decreased after game six.

10.
d)

The median changes from 89 to 87.

11.
a)

The mean changes from an 85 to a 91.

12.
d)

48

FAQs

How does this worksheet help students learn to find and interpret the mean as a balance point?

This Grade 6 worksheet uses 12 data-analysis questions to develop mean reasoning through number lines, line plots, lists of values, and real-world contexts. Students identify data sets with a specified balance point, calculate means, and solve for a missing value that makes a target mean possible. They also interpret how adding or replacing a value changes the mean rather than treating mean as only a calculation.

How can I use this worksheet to teach mean as a balance point and connect it to median?

Introduce the balance-point idea with a simple number line or line plot, asking students to identify where the data would balance before they calculate. Then use the worksheet’s mean items to model adding data values and dividing by the number of values, followed by the missing-value questions to connect a target mean with a required total. Finish with the items about removing 95 from a temperature set and replacing a test grade so students compare how changes affect the mean versus the median.

What mistakes should I watch for when students complete this mean and median worksheet?

Students may confuse the mean or balance point with the most common value, an endpoint, or the middle plotted value on a line plot. Watch for skipped data points when reading Xs, incorrect division after finding a total, and choosing a value without checking whether it produces the requested mean. In the median item, students may reorder the data incorrectly or use the original number of values after 95 is removed; in the grade-replacement item, they may add the new score without removing the original score.

How do I assign and grade this Grade 6 mean and median worksheet?

This worksheet is available as a printable PDF and as a digital quiz on Wayground, with a complete answer key for all 12 items, including the multiple-select question. You can grade printable submissions by scanning student work with the Wayground for Teachers app. The printable format also gives schools an option for reducing screen time during math practice.

How can I differentiate the number-line and line-plot questions on this worksheet?

Use the worksheet’s Advanced Settings to adjust font spacing or increase the font size so the number lines, line plots, and data values are easier to read. You can also apply a dyslexia-friendly font or translate the worksheet into another language when those file-level options support access to the mean, median, and balance-point tasks.

Where can I find more worksheets like this on Wayground?

Wayground offers a comprehensive collection of free printable worksheets and practice problems across all subjects, with downloadable PDFs and answer keys to help students master essential skills and concepts. Browse more resources at https://wayground.com/en-us/worksheets.