

Wayground
Mean, Median, and Range - Spicy - Printable Mathematics Worksheets class 7 - Wayground

Mean, Median, and Range - Spicy

8 questions

7th - 7th Grade

Mathematics

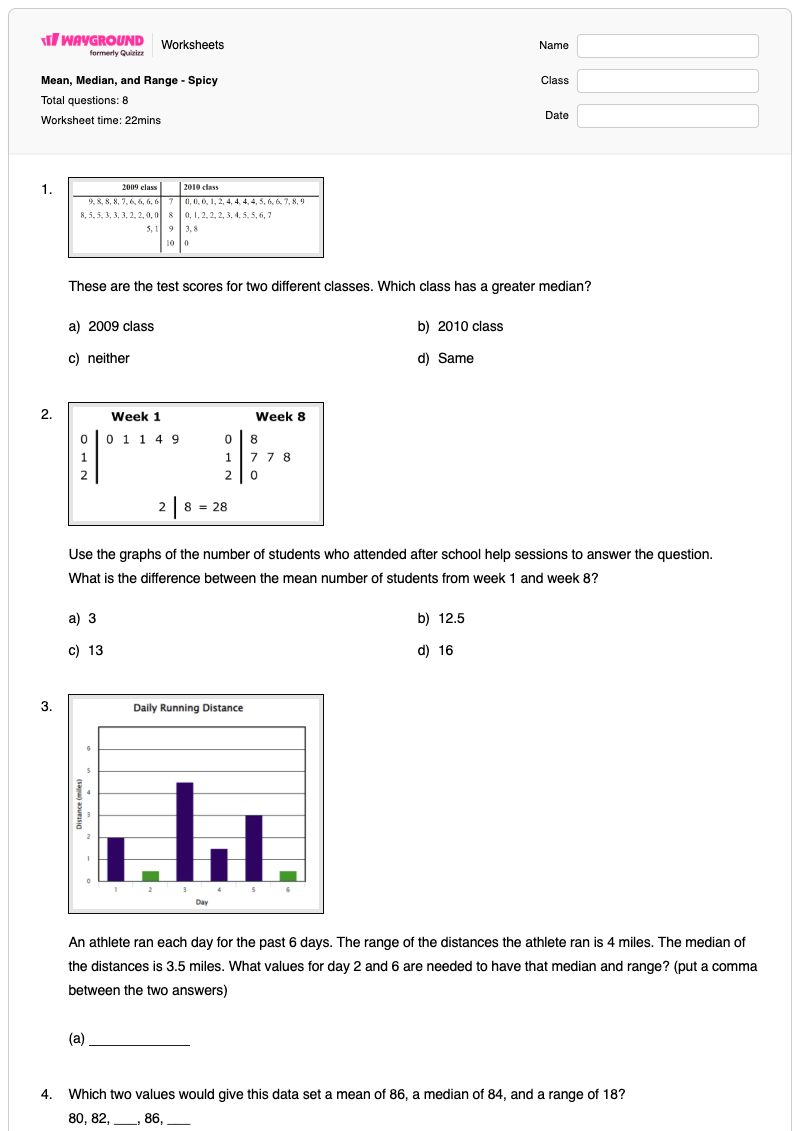
Mean, Median, and Range - Spicy is a Grade 7 mathematics worksheet that develops students’ ability to analyze and apply measures of center and spread in authentic data situations. Across 8 items, students compare medians, calculate differences between means, order data groups by mean, and determine the range of a data set. They also solve fill-in-the-blank and drag-and-drop problems that require missing values to satisfy multiple conditions involving mean, median, mode, range, and ascending order. The worksheet uses 4 multiple-choice questions, 2 fill-in-the-blank questions, 1 ordering task, and 1 drag-and-drop image activity. Its multi-step items ask students to reason backward from statistical constraints rather than simply compute a single measure, including finding possible quiz scores and completing data sets. This free printable worksheet is designed for Grade 7 math practice, independent work, review, or formative assessment, and it includes an answer key for efficient checking.

Worksheet settings

Font size

S
M
L
XL
Worksheets

Mean, Median, and Range - Spicy

Total questions: 8

Name
Class
Date
1.

These are the test scores for two different classes. Which class has a greater median?

a)

2009 class

b)

2010 class

c)

neither

d)

Same

2.

Use the graphs of the number of students who attended after school help sessions to answer the question.

What is the difference between the mean number of students from week 1 and week 8?

a)

3

b)

12.5

c)

13

d)

16

3.

An athlete ran each day for the past 6 days. The range of the distances the athlete ran is 4 miles. The median of the distances is 3.5 miles. What values for day 2 and 6 are needed to have that median and range? (put a comma between the two answers)

(a)  

4.

Which two values would give this data set a mean of 86, a median of 84, and a range of 18?

80, 82, ___, 86, ___

(enter them least to greatest)

(a)  

5.

Matthew conducts a survey for which he collects people’s ages. The results of Matthew’s survey are shown.

    • Group 1: 40 30 20     35

• Group 2: 24 32 26 45    

 • Group 3: 20 36 36 30 36

Order the groups based on their mean.

a)

Group 1

b)

Group 3

c)

Group 2

1)
2)
3)
6.

Matthew conducts a survey for which he collects people’s ages. The results of Matthew’s survey are shown.

    • Group 1: 40 30 20     35

• Group 2: 24 32 26 45    

 • Group 3: 20 36 36 30 36

What is the difference between the highest and lowest mean?

a)

0.5

b)

0.15

c)

0.45

7.

Three values are missing from the data set. Given that the mode is 44, the mean is 58, the range is 44, and the data is in ascending order, find the missing values.

8.

You want to retake two quizzes out of the five you have taken this trimester.

Your scores on the other three were 86, 92, and 95. You want the mean to be 93. The range ends up being 12. What are possible scores to satisfy these conditions?

a)

94, 98

b)

92, 100

c)

90, 98

d)

94, 96

Answer Key

Mean, Median, and Range - Spicy

Total questions: 8

1.
a)

2009 class

2.
c)

13

3.
4, 5.5, 5.5, 4
4.
84, 98
5.
a, b, c
6.
a)

0.5

7.
8.
a)

94, 98

FAQs

What does the Mean, Median, and Range - Spicy worksheet cover?

This Grade 7 worksheet has 8 items in multiple-choice, fill-in-the-blank, ordering, and drag-and-drop formats. Students compare medians, calculate differences between means, rank groups by mean, and find missing values that satisfy combinations of mean, median, mode, range, and ordering conditions. These tasks build both statistical computation and the ability to reason from constraints in a data set.

How can I use this worksheet to teach students to apply mean, median, and range?

Begin by reviewing how each measure is calculated, then model one data-group comparison before asking students to complete the worksheet. Use the ordering task and the mean-difference question to prompt students to show their totals and divide by the number of values, while the missing-value items can support a discussion about working backward from a target mean, median, mode, or range. Have students explain why their completed data sets satisfy every condition, not just one.

What mistakes should I watch for when students complete this worksheet?

Watch for students comparing only the largest or smallest values when a question asks for the median or mean, and for errors caused by forgetting that groups contain different numbers of ages. In the fill-in-the-blank and drag-and-drop items, students may find values that meet one condition but fail to check the mean, median, mode, range, and ascending-order requirements together. Students may also report the difference between two means without subtracting the lower mean from the higher mean.

How do I assign and grade this mean, median, and range worksheet?

On Wayground, assign this worksheet either as a printable PDF or as a digital quiz. It includes a complete answer key for the 4 multiple-choice, 2 fill-in-the-blank, ordering, and drag-and-drop items; printable submissions can also be graded by scanning student work with the Wayground for Teachers app. The printable format can support schools that are reducing screen time.

How can I differentiate this worksheet for my students?

Use the worksheet’s Advanced Settings to adjust font spacing or increase the font size when students need more room to read the data sets and record calculated values. You can also enable a dyslexia-friendly font or translate the worksheet into another language, helping students focus on comparing means, medians, modes, and ranges rather than on text access.

Where can I find more worksheets like this on Wayground?

Wayground offers a comprehensive collection of free printable worksheets and practice problems across subjects, with downloadable PDFs and answer keys to help students master essential skills and concepts. Browse more resources at https://wayground.com/en-us/worksheets.