Writing Equations Given a Graph, Table, or Two Points
Created by Jennifer Creamer
15 questions
8th Grade
Math
Updated Oct 2026
Writing Equations Given a Graph, Table, or Two Points is a Grade 8 mathematics worksheet that helps students connect linear representations and write equations. Across 15 multiple-choice questions, students identify equations represented by graphs and tables, determine slope and y-intercept, recognize the roles of m and b in y = mx + b, and write slope-intercept equations from two points.
This free printable worksheet gives students repeated practice moving between visual, numerical, and algebraic representations of linear functions. It is useful for introducing or reviewing how to calculate slope, identify a y-intercept, and use those values to select or construct an equation. A complete answer key is included so teachers can check understanding and address errors in students’ reasoning.
Worksheet settings
Font size
S
M
L
XL
Worksheets
Writing Equations Given a Graph, Table, or Two Points
Total questions: 15
Name
Class
Date
1.
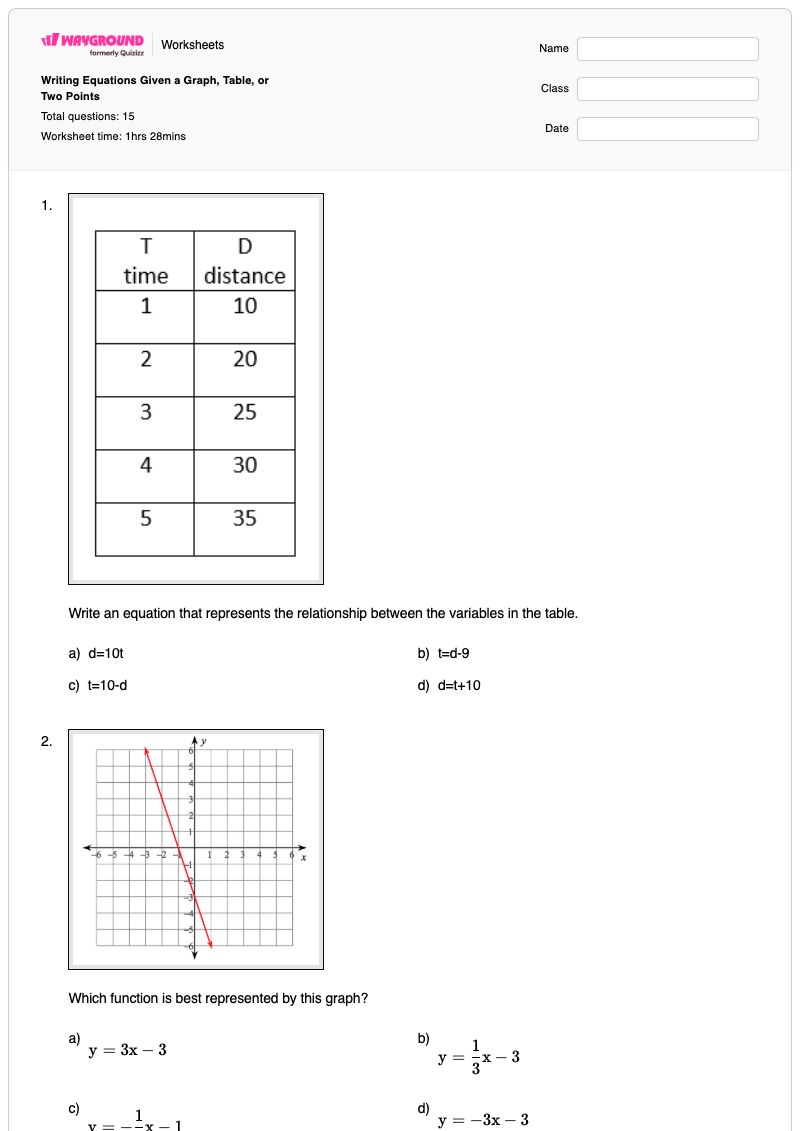
Write an equation that represents the relationship between the variables in the table.
a)
d=10t
b)
t=d-9
c)
t=10-d
d)
d=t+10
2.
Which function is best represented by this graph?
a)
y=3x−3
b)
y=31x−3
c)
y=−31x−1
d)
y=−3x−3
3.
Which function is best represented by this graph?
a)
y=4x+2
b)
y=41x+2
c)
y=1x+4
d)
y=2x
4.
Which function is best represented by this graph?
a)
y=32x−1
b)
y=23x−1
c)
y=3x−1
d)
y=−32x−1
5.
Which function is best represented by this graph?
a)
y=2x+3
b)
y=21x+3
c)
y=−2x+6
d)
y=−21x+3
6.
Write the linear equation in y = mx + b form using the given points.
a)
y = -2x + 1
b)
y = -3x + 1
c)
y = 2x + 1
d)
y = 3x - 1
7.
Write an equation in slope-intercept form from the points (0, 3) and (-4, -1)
a)
y = x + 3
b)
y = x - 3
c)
y = x + 1
d)
y = 3x + 1
8.
Write the linear equation in y = mx + b form using the given points.
a)
y = -2x + 1
b)
y = 1/2x - 2
c)
y = 2x - 1
d)
y = -1/2x + 2
9.
What is the algebraic equation for the following table?
a)
y = x + 3
b)
y = 3x
c)
y = x ÷ 3
d)
y = x - 3
10.
What is the equation of the linear function?
a)
y = -3x + 10
b)
y = -3x + 16
c)
y = 3x + 10
d)
y = 3x + 16
11.
Given the table, write the equation in the slope-intercept form.
a)
y = 1/3x + 6
b)
y = 3x + 6
c)
y = 2x + 6
d)
y = 1/2x + 6
12.
What is the slope?
a)
-1/3
b)
-3
c)
-4
d)
5
13.
In slope intercept form (y=mx+b) what is the "m"?
a)
The y-intercept
b)
The x-intercept
c)
The slope (rate of change)
d)
A point
14.
In slope intercept form (y=mx+b) what is the "b"?
a)
The y-intercept
b)
The x-intercept
c)
The slope (rate of change)
d)
A point
15.
Given the table of values, which point is a y-intercept?
a)
-6
b)
38
c)
44
d)
32
Answer Key
Writing Equations Given a Graph, Table, or Two Points
Total questions: 15
1.
a)
d=10t
2.
d)
y=−3x−3
3.
b)
y=41x+2
4.
a)
y=32x−1
5.
d)
y=−21x+3
6.
b)
y = -3x + 1
7.
a) y = x + 3
8.
d)
y = -1/2x + 2
9.
d)
y = x - 3
10.
d) y = 3x + 16
11.
c) y = 2x + 6
12.
b) -3
13.
c) The slope (rate of change)
14.
a) The y-intercept
15.
d) 32
140 %
Browse by subjects
Browse by grades
Browse by format
FAQs
What does this worksheet cover?
This Grade 8 worksheet covers writing and identifying linear equations from graphs, tables, and pairs of points. Its 15 multiple-choice questions require students to connect each representation to slope-intercept form, determine the slope and y-intercept, and identify what m and b mean in y = mx + b.
How can I use this worksheet to teach writing equations from graphs, tables, and two points?
Use the worksheet after modeling how to find the rate of change and initial value from a table, read a graph, and calculate slope from two points. Ask students to explain why a selected equation matches the given representation, then have them compare questions that provide points with those that provide tables or graphs. This sequence reinforces that the same linear relationship can be expressed in several forms.
What mistakes should I watch for when students complete this worksheet?
Watch for students reversing the roles of m and b, choosing the y-intercept when asked for the slope, or using the wrong sign when calculating slope from two points. In the table and graph items, students may focus on an individual value instead of the constant rate of change or fail to identify the y-intercept. Have students substitute a point into a proposed equation to check their selected answer.
How do I assign and grade this worksheet?
This worksheet is available as a printable PDF and as a digital quiz on Wayground, with a complete answer key included for the 15 multiple-choice questions. Printable submissions can be graded by scanning student work with the Wayground for Teachers app. The PDF option also supports schools that want to reduce screen time while keeping equation practice accessible.
How can I differentiate this worksheet for my students?
Use the worksheet’s Advanced Settings to adjust font spacing and font size so the graph, table, and equation choices are easier to follow. You can also apply a dyslexia-friendly font or translate the worksheet into another language when appropriate. These changes preserve the worksheet’s focus on selecting and writing linear equations from graphs, tables, and points.
Where can I find more worksheets like this on Wayground?
Wayground offers a comprehensive collection of free printable worksheets and practice problems across all subjects, including downloadable PDFs and answer keys to support essential skills and concepts. Browse more resources at https://wayground.com/en-us/worksheets.


 Worksheets


