

Wayground
Econ U2 practice - Printable Social studies Worksheets class 12 - Wayground

Econ U2 practice

Michael Ford

Created by Michael Ford

18 questions

9th - 12th Grade

Social studies

Econ U2 practice is a free printable worksheet for Grade 9–12 social studies students reviewing demand and supply relationships. Across 18 questions—17 multiple choice and one multiple-select item—students identify the law of demand, distinguish changes in quantity demanded or supplied from shifts in demand or supply, and connect each change to price or other determinants. The worksheet also includes graph-based questions that ask students to recognize shifts and movements in demand and supply curves. Students apply the P.I.N.E.R. and S.C.E.N.T. cues, interpret curve changes, and select all relevant factors such as consumer preferences, expectations, number of buyers, and income. A complete answer key is included for efficient checking, reteaching, or independent review.

Worksheet settings

Font size

S
M
L
XL
WaygroundWorksheets

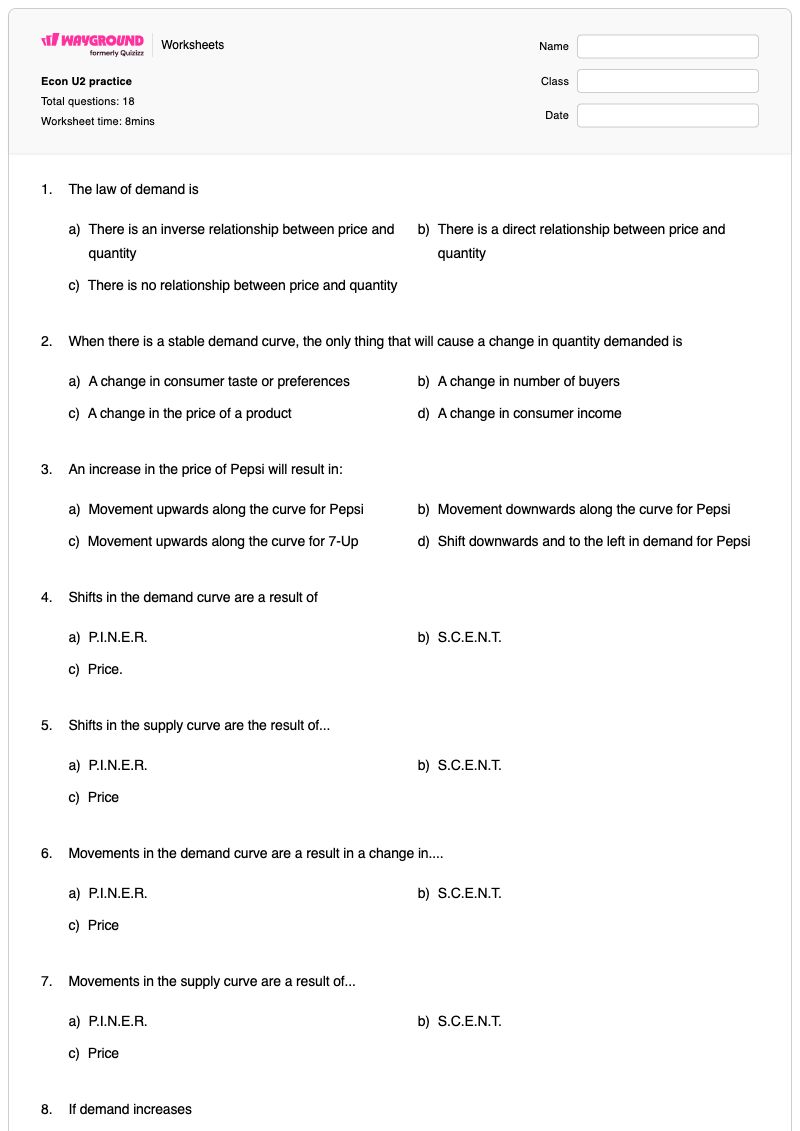
Econ U2 practice

Total questions: 18

Name
Class
Date
1.

The law of demand is

a)

There is an inverse relationship between price and quantity

b)

There is a direct relationship between price and quantity

c)

There is no relationship between price and quantity

2.

When there is a stable demand curve, the only thing that will cause a change in quantity demanded is

a)

A change in consumer taste or preferences

b)

A change in number of buyers

c)

A change in the price of a product

d)

A change in consumer income

3.

An increase in the price of Pepsi will result in:

a)

Movement upwards along the curve for Pepsi

b)

Movement downwards along the curve for Pepsi

c)

Movement upwards along the curve for 7-Up

d)

Shift downwards and to the left in demand for Pepsi

4.

Shifts in the demand curve are a result of

a)

P.I.N.E.R.

b)

S.C.E.N.T.

c)

Price.

5.

Shifts in the supply curve are the result of...

a)

P.I.N.E.R.

b)

S.C.E.N.T.

c)

Price

6.

Movements in the demand curve are a result in a change in....

a)

P.I.N.E.R.

b)

S.C.E.N.T.

c)

Price

7.

Movements in the supply curve are a result of...

a)

P.I.N.E.R.

b)

S.C.E.N.T.

c)

Price

8.

If demand increases

a)

There will be a shift to the left

b)

There will be a shift to the right

c)

There will be movement down the curve

d)

There will be movement up the curve

9.

If demand Decreases

a)

There will be movement up the curve

b)

There will be movement down the curve

c)

There will be a shift left

d)

There will be a shift right

10.

An increase in Quantity demanded results in

a)

A movement on the demand curve.

b)

A shift to the left of the demand curve.

c)

A shift to the right of the demand curve.

11.

A shift to the demand curve can be caused by a change in (mark all that are correct)

a)

Consumer preference

b)

Consumer expectations

c)

Number of buyers

d)

Subsidies

e)

Consumer income

12.
The image to the left indicates

The image to the left indicates

a)

A shift in the demand curve

b)

A movement in the demand curve

c)

No change in the demand curve.

13.
The demand curve to the left indicates

The demand curve to the left indicates

a)

A movement along the demand curve

b)

A shift in demand.

14.

Which of these graphs indicates a shift in supply?

a)
Which of these graphs indicates a shift in supply?

b)
Which of these graphs indicates a shift in supply?

c)
Which of these graphs indicates a shift in supply?

d)
Which of these graphs indicates a shift in supply?

15.

Which of these graphs indicates a movement of quantity supplied?

a)
Which of these graphs indicates a movement of quantity supplied?

b)
Which of these graphs indicates a movement of quantity supplied?

c)
Which of these graphs indicates a movement of quantity supplied?

d)
Which of these graphs indicates a movement of quantity supplied?

16.

Which of these is a supply curve?

a)
Which of these is a supply curve?

b)
Which of these is a supply curve?

17.

Which of these is a demand curve?

a)
Which of these is a demand curve?

b)
Which of these is a demand curve?

18.

Which of the following illustrates the concept of diminishing marginal utility

a)

A furniture company buys wood to make furniture.

b)

A furniture company buys less wood because they have a more efficient way to manufacture furniture.

c)

Jayleon buys a car to go to work.

d)

Jayleon gets less enjoyment out of his 5th car than he does from his 1st car.

WaygroundAnswer Key

Econ U2 practice

Total questions: 18

1.
a)

There is an inverse relationship between price and quantity

2.
c)

A change in the price of a product

3.
a)

Movement upwards along the curve for Pepsi

4.
a)

P.I.N.E.R.

5.
b)

S.C.E.N.T.

6.
c)

Price

7.
c)

Price

8.
b)

There will be a shift to the right

9.
c)

There will be a shift left

10.
a)

A movement on the demand curve.

11.
a)

Consumer preference

, b)

Consumer expectations

, c)

Number of buyers

, e)

Consumer income

12.
a)

A shift in the demand curve

13.
a)

A movement along the demand curve

14.
b)
15.
b)
16.
b)
17.
a)
18.
d)

Jayleon gets less enjoyment out of his 5th car than he does from his 1st car.

FAQs

What does the Econ U2 practice worksheet cover?

This 18-question worksheet builds students’ ability to distinguish movements along demand or supply curves from shifts in the curves. Its 17 multiple-choice and one multiple-select questions cover the law of demand, price changes, P.I.N.E.R. and S.C.E.N.T. determinants, and graph interpretation so students connect an economic change to the correct curve response.

How can I use this worksheet to teach demand and supply curve shifts?

Introduce the worksheet by contrasting a price change with a change in a nonprice determinant, then model how each appears on a demand or supply graph. Have students explain why price produces movement along a curve while factors such as preferences, expectations, number of buyers, or income can shift demand. Use the graph questions afterward to check whether students can apply the distinction visually.

What mistakes should I watch for when students complete this economics worksheet?

Watch for students confusing an increase in quantity demanded with an increase in demand: the former is movement along the demand curve, while the latter is a shift to the right. Students may also select price as a cause of a curve shift or confuse the P.I.N.E.R. cue for demand shifts with the S.C.E.N.T. cue for supply shifts. In the multiple-select item, check that students identify all applicable demand-shift factors rather than choosing only one.

How do I assign and grade this Econ U2 practice worksheet?

The worksheet is available as a printable PDF and as a digital quiz on Wayground, and it includes a complete answer key for all 18 items. For printable submissions, you can scan student work with the Wayground for Teachers app to support grading and review.

How can I differentiate this demand and supply worksheet for my students?

Because the worksheet combines text-based multiple-choice items with demand and supply graph questions, you can adjust font spacing and font size to make the prompts and graph labels easier to read. Under the worksheet’s Advanced Settings, you can also select a dyslexia-friendly font or translate the worksheet into another language when appropriate.

Where can I find more worksheets like this on Wayground?

Wayground offers a comprehensive collection of free printable worksheets and practice problems across subjects, with downloadable PDFs and answer keys to help students master essential skills and concepts. Browse more resources at https://wayground.com/en-us/worksheets.