Filters
Resource Type

Grades
Math Quizzes
Challenge your mathematical skills and assess your understanding with our comprehensive collection of math quizzes on Wayground. These interactive practice questions provide instant feedback to help you master essential math concepts through self-paced assessment and targeted problem-solving exercises.

13 questions
Fractions on a number line
Quiz
•
3rd Grade
10 questions
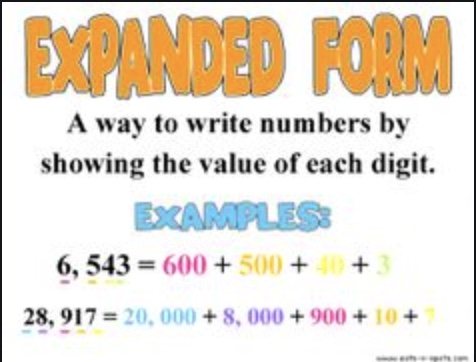
Expanded Form
Quiz
•
4th Grade

17 questions
Prime and Composite Numbers
Quiz
•
4th Grade

10 questions
Rounding numbers
Quiz
•
3rd Grade

20 questions
Rounding Numbers
Quiz
•
3rd Grade

16 questions
Time and Elapsed Time Pre-Test
Quiz
•
4th Grade
10 questions
Fraction Vocabulary
Quiz
•
4th Grade
21 questions
Rounding Numbers
Quiz
•
3rd Grade
9 questions
Comparing Whole Numbers
Quiz
•
4th Grade
12 questions
Addition within 100
Quiz
•
2nd Grade
14 questions
comparing whole numbers
Quiz
•
5th Grade
20 questions
Comparing whole numbers
Quiz
•
2nd Grade
Explore Math Quizzes
Math quizzes provide educators with comprehensive assessment tools to evaluate student understanding across fundamental mathematical concepts, from basic arithmetic operations to advanced problem-solving strategies. These interactive practice questions enable students to demonstrate their computational skills, logical reasoning abilities, and mathematical thinking processes while receiving immediate feedback on their performance. Through carefully structured quiz formats, learners can identify areas requiring additional practice, reinforce newly acquired mathematical knowledge, and build confidence in their ability to tackle increasingly complex mathematical challenges across various topic areas including algebra, geometry, statistics, and number theory. Wayground (formerly Quizizz) empowers mathematics teachers with access to millions of educator-created quiz resources designed to support diverse instructional needs and learning objectives. The platform's robust search and filtering capabilities allow instructors to quickly locate age-appropriate content aligned with curriculum standards, while customization tools enable seamless differentiation for students at varying skill levels. Teachers can deploy these digital assessments in multiple formats including live classroom activities, self-paced assignments, and homework practice sessions, making them invaluable for lesson planning, targeted remediation, and enrichment opportunities. These flexible quiz collections support ongoing skill reinforcement and provide educators with detailed analytics to inform instructional decisions and track student progress throughout the academic year.
Accessibility
Features
Wayground Super
School & District
Wayground for Business
Create a quiz
Create a presentation
Wayground AI
Subjects
Mathematics
Social Studies
Science
Physics
Chemistry
Biology
About
Our Story
Wayground Blog
Media Kit
Careers
Support
F.A.Q.
Help & Support
Privacy Policy
Terms of Service
Teacher Resources
2026 Wayground


Get our app

