
 Worksheets
Stem and Leaf Diagrams
Total questions: 10
Worksheet time: 10mins
Name
Class
Date
1.

How many students scored full marks on the test?
a)
0
b)
2
c)
6
d)
1
2.

How many students scored more than 80%?
a)
10
b)
2
13
13
c)
7
d)
15
3.
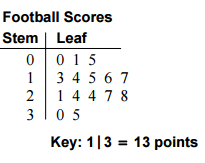
How many games did the team play?
a)
15
b)
12
c)
24
d)
14
4.
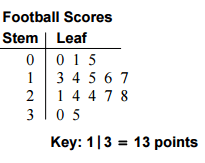
In how many games did the team score more than 20 points?
a)
8
b)
7
c)
10
d)
9
5.

In how many games did the team score fewer than 10 points?
a)
3
b)
5
c)
4
d)
6
6.

What is the minimum in this data set?
a)
0
b)
4
c)
9
d)
40
7.

How many scores are listed in this Stem and Leaf Plot?
a)
3
b)
6
c)
9
d)
18
8.

What is wrong with this stem and leaf diagram?
a)
Nothing- it's all correct.
b)
The order.
c)
It's missing a key.
d)
The title.
9.

What type of correlation does this graph have?
a)
Positive
b)
Negative
c)
None
d)
All of the above
10.

The scatter plot shows the relationship between the number of chapters and the total number of pages for several books. Use the trend line to predict how many chapters would be in a book with 180 pages.
a)
12 chapters
b)
15 chapters
c)
18 chapters
d)
21 chapters
100 %

