
 Worksheets
Math in Science
Total questions: 20
Worksheet time: 10mins
Name
Class
Date
1.

A pair of numbers that determine the position of a point on a graph.
a)
Data Point
b)
Coordinates
c)
Data Table
d)
Mean
2.

The number that appears most often in a set of data.
a)
Mean
b)
Median
c)
Mode
d)
Answer
3.

A smooth line that shows the overall trend of the data.
a)
Horizontal Line
b)
Vertical Line
c)
Line of Best Fit
d)
Parallel Line
4.

The point on the graph where the X and Y axis cross.
a)
Horizontal Axis
b)
Vertical Axis
c)
Line of best fit
d)
Origin
5.

The line on a graph that runs up and down and is where the responding variable goes.
a)
Horizontal Axis
b)
Vertical Axis
c)
Line of best fit
d)
Origin
6.

The line on a graph that runs left to right and is where the manipulated variable goes.
a)
Horizontal Axis
b)
Vertical Axis
c)
Line of best fit
d)
Parallel Line
7.

The numerical average of a set of data.
a)
Mean
b)
Median
c)
Mode
d)
Answer
8.

A point on a graph showing the location of a piece of data.
a)
Origin
b)
Data Point
c)
Best Fit Line
d)
Coordinates
9.

A line graph in which the data points create a straight line.
a)
Linear Graph
b)
Nonlinear Graph
c)
No Trend Graph
d)
Scatter Plot
10.
The middle number in a set of data.
a)
mean
b)
median
c)
mode
d)
answer
11.
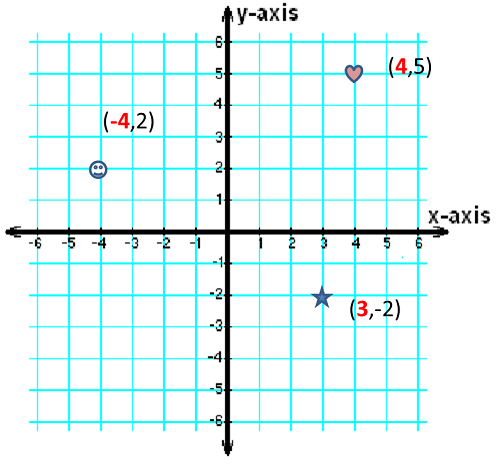
A line graph in which the data points DO NOT fall on a straight line.
a)
Linear Graph
b)
Nonlinear Graph
c)
Bar Graph
d)
Circle Graph
12.
Refers to how close a group of measurements are to each other.
a)
Accuracy
b)
Precision
c)
Mean
d)
Median
13.
Refers to how close a measurement is to the true value.
a)
Accuracy
b)
Precision
c)
Mean
d)
Median
14.
An approximation of a number based on known information.
a)
Guess
b)
Estimate
c)
Prediction
d)
Answer
15.

A picture of your data is a _________.
a)
Line
b)
Data Point
c)
Graph
d)
Data Table
16.
A ___________ is not very accurate because it is random.
a)
guess
b)
estimate
c)
prediction
d)
Hypothesis
17.

Select the vertical scale for the following set of data: 12, 23, 36, 41
a)
1's
b)
5's
c)
10's
d)
20's
18.

The title on your graph should include:
a)
Both Variables
b)
The manipulated variable
c)
The responding variable
d)
Your own words
19.

When you label the X and Y axis, always remember to include:
a)
Units
b)
Two Words
c)
Nothing
d)
The Results
20.

Why are we learning MATH in Science?
a)
Mrs. Reader is mean
b)
Math and Science go hand in hand
c)
Mrs. Scheuer needs help
d)
Math is more important :
100 %

