
 Worksheets
Math Interim Review
Total questions: 63
Worksheet time: 2hrs 53mins
Name
Class
Date
1.

Find the area of this triangle.
a)
240 ft2
b)
56 ft2
c)
66 ft2
d)
120 ft2
2.

Find the area of the parallelogram.
a)
12 units2
b)
10 units2
c)
13 units2
d)
6 units
3.
A parallelogram has a base of 35 cm and its area is 700 cm2. What is its height?
a)
20 cm
b)
24,500 cm
c)
0.05 cm
d)
2 cm
4.
The area of a rectangle is 72 sq units. One side length is 9 units. What is the other side length?
a)
54 units
b)
7 units
c)
27 units
d)
8 units
5.
What is the area of a square with a length of 4 cm?
a)
256 cm2
b)
16 square cm
c)
8 cm2
d)
128 square cm
6.
A flower garden at an amusement park is planted in the shape of a parallelogram. The base is 15 yards long and the height is 7.5 yards. What is the area of the garden?
a)
56.25 square yards
b)
112.5 square yards
c)
45 square yards
d)
22.5 square yards
7.

What is the area?
a)
108 cm sq
b)
60 cm
c)
432 cm sq
d)
216 cm sq
8.
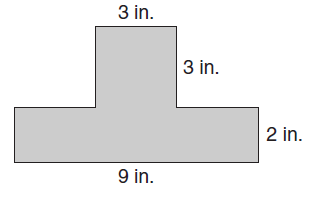
a)
27 in2
b)
36 in2
c)
18 in2
d)
I have no idea
9.

a)
120 yd2
b)
92 yd2
c)
224 yd2
d)
23 yd2
10.
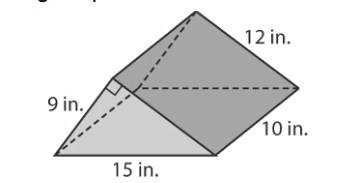
What is the total surface area of the triangular prism shown?
a)
468 in2
b)
540 in2
c)
576 in2
d)
700 in2
11.

Find the surface area of this figure.
a)
148 cm²
b)
120 cm²
12.
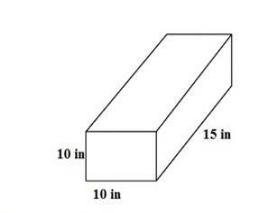
What is the surface area of this figure?
a)
200 cm 2
b)
800 cm 2
c)
400 cm 2
d)
100 cm 2
13.

What 3D solid does this net create?
a)
Triangular Pyramid
b)
Triangular Prism
c)
Square Pyramid
d)
Square Prism
14.
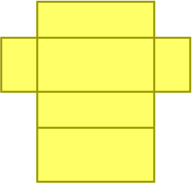
What 3D solid does this net create?
a)
Rectangular Prism
b)
Rectangular Pyramid
c)
Cube
d)
Square Prism
15.
What is volume?
a)
The measure of the amount of space inside of a solid figure
b)
The sum of all the areas of all the shapes that cover the object
16.
What is surface area?
a)
The measure of the amount of space inside of a solid figure
b)
The sum of all the areas of all the shapes that cover the object
17.

Identify the 3D solid.
a)
cube
b)
square prism
c)
square pyramid
d)
triangular pyramid
18.

Classify the 3D solid from its net.
a)
triangular prism
b)
triangular pyramid
c)
ninja star
d)
triangular net
19.

a)
The surface area is
180 square cm
180 square cm
b)
The surface area is
72 square meters
72 square meters
c)
The surface area is
144 square meters
144 square meters
d)
The surface area is 288 square meters
20.

Find the volume.
a)
490 cm3
b)
470 cm3
c)
480 cm3
d)
460 cm3
21.

Find the volume.
a)
24 m3
b)
28 m3
c)
26 m3
d)
22 m3
22.

what is the volume?
a)
72
b)
27
c)
1.5
d)
272
23.
A cube has a length of 3 inches. Find the volume.
a)
9 inches3
b)
12 inches3
c)
27 inches3
d)
18 inches3
24.
A cereal box is 12cm tall. The area of the base is 7cm. What is the volume?
a)
84 cm2
b)
84 cm3
c)
83 cm
d)
84
25.
Is the following question statistical or non statistical?
How many cars are in the parking lot?
How many cars are in the parking lot?
a)
Statsitical
b)
Non Statistical
26.
Is the following question statistical or non statistical?
How tall are the students in our class?
How tall are the students in our class?
a)
Statistical
b)
Non Statistical
27.

Describe the shape of the data in the dot plot below.
a)
Symmetric
b)
Not symmetric data pushed left
c)
Not symmetric data pushed right
d)
Uniform
28.

A teacher asked 20 students how many books they read last summer. The dot plot displays the data. What is the greatest number of books a student read?
a)
1
b)
2
c)
9
d)
10
29.
Find the mean of these numbers:
5,11,2,12,4,2
5,11,2,12,4,2
a)
4.1
b)
6
c)
4.5
d)
4
30.
What is the mean?
a)
# happening the most
b)
the number in the middle
c)
biggest-smallest
d)
the average
31.
Extreme values are also known as what?
a)
interquartile ranges
b)
modes
c)
medians
d)
outliers
32.
Which number represents the mode? 8,10,12,14,16,18,20
a)
10
b)
16
c)
no mode
d)
18
33.
Which number represents the median? 45,46,48,52,56,58,61
a)
48
b)
56
c)
52
d)
46
34.
What is the mode of the set of data? 12,13,14,14,15,16
a)
12
b)
14
c)
15
d)
16
35.
To find the average of a set of numbers, add up all the items and divide by...
a)
2
b)
The minimum
c)
The maximum
d)
The number of items
36.
A data set can have more than one mode
a)
True
b)
False
37.
What is a the meaning for "median"?
a)
fair share
b)
middle
c)
repeats the most
d)
variation
38.
The number of pages that Carolyn wrote in her journal each day from Monday to Friday is shown below:
9, 8, 12, 6, 10
What is the mean number of pages she wrote per day?
9, 8, 12, 6, 10
What is the mean number of pages she wrote per day?
a)
5
b)
6
c)
9
d)
11
39.
1- The first quartile (Q 1) is the median of the lower half of the set.
2- The second quartile (Q 2) is the median of the whole set .
3- The third quartile (Q 3) is the median of the upper half of the set.
2- The second quartile (Q 2) is the median of the whole set .
3- The third quartile (Q 3) is the median of the upper half of the set.
a)
All three statements are true.
b)
Only the 1st statement is true.
c)
Only the 2nd and the 3rd statements are true.
d)
Only the 3rd statement is true.
40.
The interquartile range (IQR) of a data set is the difference between the third and first quartiles. It represents the range of the middle half of the data.
a)
True
b)
False
41.
Given the data: 136, 150, 119, 150, 125, 143.
Find the range.
Find the range.
a)
Range = 136 - 125 = 21.
b)
Range = 150 - 125 = 75.
c)
Range = 150 - 125 = 25.
d)
Range = 150 - 119 = 31
42.
Given the data: 136, 150, 119, 150, 125, 143.
Find the interquartile range (IQR)
Find the interquartile range (IQR)
a)
IQR = 150 - 119 = 31
b)
IQR = 150 - 125 = 25.
c)
IQR = 150 - 125 = 75.
d)
IQR = 150 - 119 = 31.
43.
An outlier is a value in a data set that is much greater or much less than most of the other values in the data set.
a)
False
b)
True
44.

What type of display is pictured below?
a)
Dot Plot
b)
Box Plot
c)
Histogram
d)
Pie Chart
45.

What kind of display is pictured below?
a)
Dot Plot
b)
Box Plot
c)
Histogram
d)
Pie Graph
46.

What type of data display is pictured below?
a)
Dot Plot
b)
Box Plot
c)
Histogram
d)
Pie Graph
47.

What number represents the lower quartile?
a)
6
b)
9
c)
11
d)
14
48.

What is the median?
a)
6
b)
9
c)
11
d)
14
49.

What is the range of the display?
a)
12
b)
18
c)
5
d)
6
50.
When finding median and the middle has two numbers instead of one, what do you do?
a)
Take the higher number
b)
Take the lower number
c)
Take both
d)
Take the average
51.

Which class has the higher test score median?
a)
Class #1
b)
Class # 2
c)
The medians are equal
d)
The median is not shown here.
52.

How many students have more than 1,000 songs on their MP3 player?
a)
5
b)
16
c)
10
d)
4
53.

How many cities have temperatures between 70 degrees and 99 degrees?
a)
44
b)
34
c)
26
d)
62
54.

What percent of students have a height between 58 inches and 60 inches?
a)
25%
b)
50%
c)
75%
d)
100%
55.

What is the minimum value (lower extreme) of this data set?
a)
50
b)
30
c)
35
d)
25
56.

What is the interquartile range (IQR) of the data set?
a)
20
b)
25
c)
5
d)
10
57.
What is the outlier in this data set?
{23, 60, 30, 21, 25, 35, 29}
{23, 60, 30, 21, 25, 35, 29}
a)
35
b)
21
c)
30
d)
60
58.
How do you find the Interquartile Range?
a)
divide the 3rd quartile by the 1st quartile
b)
subtract the biggest number by the smallest number
c)
divide the biggest number by the smallest number
d)
subtract the 3rd quartile by the 1st quartile
59.
Find the 1st, 2nd, and 3rd quartile of the data set:
{4, 2, 1, 3, 13, 7, 11,15}
{4, 2, 1, 3, 13, 7, 11,15}
a)
1st: 3, 2nd: 6, 3rd: 14
b)
1st: 13.5, 2nd: 5.5, 3rd: 2.5
c)
1st: 2.5, 2nd: 5.5, 3rd: 13.5
d)
1st: 14, 2nd: 6, 3rd: 3
60.
33, 25, 42, 25, 31, 37, 46, 29, 38
What is the third quartile of the data?
What is the third quartile of the data?
a)
37
b)
38
c)
40
d)
46
61.
33, 25, 42, 25, 31, 37, 46, 29, 38
What is the first quartile of the data?
What is the first quartile of the data?
a)
25
b)
27
c)
29
d)
33
62.
Roger bowled 7 games last weekend. His scores are: 155, 165, 138, 172, 127, 193, 142. What is the range of Roger's scores?
a)
193
b)
127
c)
60
d)
66
63.
Find the range.
12, 5, 9, 18, 22, 25, 5
12, 5, 9, 18, 22, 25, 5
a)
20
b)
15
c)
22
d)
18
100 %

