
 Worksheets
Statistics Review
Total questions: 40
Worksheet time: 10hrs 0mins
Name
Class
Date
1.
Mean and average are synonyms.
a)
True
b)
False
2.
A mean (or average) is:
a)
The sum of all the numbers in a set of data.
b)
The sum of all numbers in a set of data divided by the number of data points in the set.
c)
The difference between each number in the data set.
d)
The product of all the numbers in the data set divided by the number of data points in the set.
3.
The median of a data set is:
a)
The greatest extreme value of a data set when placed in greatest to least order.
b)
The middle value of a data set when placed in least to greatest order.
c)
The smallest extreme value in a data set when placed in greatest to least order.
d)
None of the above.
4.
The mode of a data set is said to be:
a)
The number that appears the least often in a data set.
b)
The number that appears the most frequently in a data set.
c)
A setting which allows better data visualization.
d)
Any number that appears only once in the data set.
5.
Identify the median in the following data set:
59, 61, 63, 63, 64, 67, 72
59, 61, 63, 63, 64, 67, 72
a)
59
b)
72
c)
67
d)
63
6.
Identify the mode of the same data set:
59, 61, 63, 63, 64, 67, 72
59, 61, 63, 63, 64, 67, 72
a)
59
b)
63
c)
67
d)
72
7.
A frequency table is used to:
a)
Show the number of times a data value or range of values occurs in the data set using tally marks.
b)
Show how extreme each outlier is.
c)
Illustrate if a data set is skewed or symmetrical.
d)
Show how often a data set is changed.
8.
A histogram is a graph that:
a)
Uses data collected from historical sources.
b)
Uses bars to show the frequency of data in intervals.
c)
Illustrates the history of collected data points.
d)
None of the above.
9.
What do you do if there are two numbers in "the middle" when you are finding the median?
a)
Pick your favorite number.
b)
Add the two numbers in the middle & then divide by two.
c)
They are both the median.
d)
None of the above.
10.
A data set can have more than one median?
a)
True
b)
False
11.
What is the mode in this set of data?
2, 3, 3, 4, 6, 7, 7
2, 3, 3, 4, 6, 7, 7
a)
3 and 7
b)
3
c)
7
d)
2 , 4, and 6
12.
The number of miles that Jenna cycled each week for a 7-week period is shown:
36, 42, 28, 52, 48, 36, 31
What is the mean number of miles Jenna cycled?
36, 42, 28, 52, 48, 36, 31
What is the mean number of miles Jenna cycled?
a)
31
b)
36
c)
39
d)
41
13.

How many students were interviewed in this survey?
a)
1
b)
5
c)
7
d)
8
14.

How many people have more than four books in their desk?
a)
7
b)
12
c)
5
d)
8
15.
A statistical question is defined to be:
a)
A question that involves numerical values.
b)
A question that anticipates exactly one answer.
c)
A question that anticipates a large amount of data that varies.
d)
There is no such thing as a statistical question.
16.
Find the mode of these numbers:
4,3,6,4,3,6,6,3,2,1,3
4,3,6,4,3,6,6,3,2,1,3
a)
3
b)
6
c)
4
d)
2
17.
Find the mean of these numbers:
5,11,2,12,4,2
5,11,2,12,4,2
a)
4.1
b)
6
c)
4.5
d)
4
18.
Find the mode of these numbers:
4,4,6,6,2,2,6,2,4,2
4,4,6,6,2,2,6,2,4,2
a)
2
b)
4
c)
6
d)
2.4
19.
Find the mean of these numbers:
4,2,5,6,3
4,2,5,6,3
a)
2
b)
5
c)
4
d)
6
20.

How many cars were sold on Saturday and Sunday?
a)
5
b)
3
c)
8
d)
10
21.

How many students had more than 6 candy bars?
a)
5
b)
2
c)
3
d)
1
22.

How many cars were sold on Monday and Tuesday?
a)
13
b)
5
c)
11
d)
2
23.

How many people had 3 pets?
a)
5
b)
7
c)
4
d)
3
24.

How many students received a score in the 80's?
a)
2
b)
10
c)
14
d)
27
25.
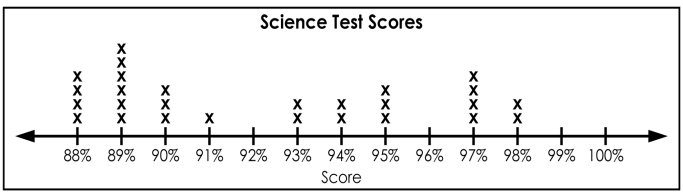
How many students scored 93% or less?
a)
6
b)
16
c)
14
d)
13
26.

How many employees are there that make between $33,000 and $43,000
a)
250
b)
500
c)
550
d)
750
27.

Elliot says almost everyone arrived at the party after 10:00 P.M., but Nancy thinks most people came earlier. When did a majority of the people arrive?
a)
7:00-7:59 P.M.
b)
8:00–8:59 P.M.
c)
9:00–9:59 P.M.
d)
10:00–10:59 P.M.
28.

How many students were greater than or equal to 60 inches tall?
a)
21
b)
11
c)
17
d)
6
29.

How many students have 0 Brothers and Sisters?
a)
6 students
b)
0 students
c)
12 students
d)
10 students
30.

How many students have 1 Brother and Sister?
a)
10 students
b)
5 students
c)
7 students
d)
2 students
31.

How many students have 2 Brothers and Sisters?
a)
4 students
b)
7 students
c)
0 students
d)
3 students
32.

Students at Cooper Elementary school took a survey about what kinds of pets they had at home. Then, students plotted that information on a frequency table.
How many kids have dogs and cats for pets?
How many kids have dogs and cats for pets?
a)
19
b)
12
c)
7
d)
20
33.

How many films earned under $40 million?
a)
3
b)
14
c)
17
d)
9
34.
Is the following question statistical or non statistical?
How many cars are in the parking lot?
How many cars are in the parking lot?
a)
Statsitical
b)
Non Statistical
35.
Is the following question statistical or non statistical?
How tall are the students in our class?
How tall are the students in our class?
a)
Statistical
b)
Non Statistical
36.
Is the following question statistical or non statistical?
How many ceiling tiles are in our classroom?
How many ceiling tiles are in our classroom?
a)
Statistical
b)
Non Statistical
37.
Is the following question statistical or non statistical?
What is your favorite color?
What is your favorite color?
a)
Statistical
b)
Non Statistical
38.

Which dot plot shows more variability? a or b?
a)
a
b)
b
39.

Which dot plot has the greatest variability?
a)
A
b)
B
c)
C
d)
D
40.

Which is the correct data set for the dot plot?
a)
1, 2, 3, 4, 5, 6, 7, 8, 9,
b)
1, 2, 2, 3, 3, 3, 4, 4, 4, 4, 5, 5, 5, 7, 9
c)
1, 2, 3, 4, 5, 7, 9
100 %

