
NEW
Font size
S
M
L
XL
 Worksheets
Speed, Graphs, and Inclined Planes
Total questions: 27
Worksheet time: 25mins
Name
Class
Date
1.

What is happening in this graph from point B to C?
a)
The object is going down a hill.
b)
The object is returning to its starting location.
c)
The object is slowing down.
d)
The object is staying still.
2.

What does this graph represent?
a)
Constant speed
b)
Acceleration
c)
Not moving
3.

How long did it take this object to travel 10 m?
a)
0 s
b)
10 s
c)
15 s
d)
20 s
4.

At 60 seconds, how far had this object traveled?
a)
0 m
b)
10 m
c)
20 m
d)
40 m
5.
An inclined plane reduces the amount of force needed to move an object by -
a)
increasing the distance the object moves.
b)
transferring more of the force to the object
c)
reversing the direction the object is moved.
6.
Soccer ball A goes 15 feet in 3 seconds, and Ball B goes 12 feet in 2 seconds. Which ball moved the fastest?
a)
Soccer Ball A
b)
Soccer Ball B
c)
Their speeds are equal.
7.
A dog can run 50 km in 5 days and a cat can run 15 km in 3 days. What is the difference in the two speeds? (Hint: You need to subtract!)
a)
10 km/day
b)
5 km/day
c)
15 km/day
d)
50 km/day
8.
A dog runs 100 meters in 4 seconds. A lion runs 250 meters in 10 seconds. What is the difference in their speeds?
a)
A. The dog is 100 m faster.
b)
B. The lion 102 m/s slower.
c)
D. The dog is 45 m/s faster.
d)
C. Their speeds are equal.
9.
What is the equation to calculate speed?
a)
speed = distance/time
b)
speed = time/distance
c)
speed = time x distance
d)
speed = speed/time
10.
If an object travels 42 meters in 6 seconds, what is its average speed?
a)
6 m/s
b)
7 m/s
c)
48 m/s
d)
252 m/s
11.
A unusually fast zombie was chasing after Carl to eat him. What was the zombie’s speed at 6 seconds if he traveled 36 meters?
a)
6 meters/seconds
b)
6 seconds/meters
c)
.17 meters/second
d)
None of the above
12.
Marni runs 1500 meters around the school track. What does she need to know in order to find out her speed?
a)
her time from start to finish
b)
the number of steps she took
c)
her heart rate at the finish line
d)
the direction she began running
13.
Marlon decided to visit Dallas, which is 210 miles away from Houston. His trip took him 3 hours to complete. Calculate his average speed.
a)
60 mph
b)
64 mph
c)
70 mph
d)
3 mph
14.
A ladybug moves from 2 cm to 7 cm in 25 seconds. What is the speed of the ladybug? (Hint: To find the total distance, you have to subtract!)
a)
5 cm/second
b)
0.2 cm/second
c)
12 cm/second
d)
3.57 cm/second
15.
What is the average speed of the ball if it falls 20 meters 40 seconds?
a)
A. 20 m/s
b)
B. 10 m/s
c)
C. 0.5 m/s
d)
D. 2 m/s
16.
If a cheetah runs 180 miles in 3 hours, what is its average speed?
a)
60 hours
b)
60 miles
c)
60 miles/hour
d)
60 miles/second/second
17.

What is this graph representing?
a)
Constant Speed
b)
Acceleration (speeding up)
c)
Deceleration (slowing down)
d)
No motion
18.

What is happening in this graph from point B to C?
a)
The object is going down a hill.
b)
The object is returning to its starting location.
c)
The object is slowing down.
d)
The object is staying still.
19.

What is happening in this graph from point A to B?
a)
The object is accelerating.
b)
The object is not moving.
c)
The object is decelerating.
d)
The object is moving at a constant speed.
20.
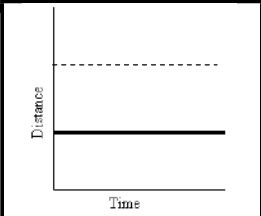
What does this graph represent?
a)
Constant speed
b)
Acceleration
c)
Not moving
21.

How long did it take this object to travel back to its reference/starting point?
a)
20 s
b)
30 s
c)
60 s
d)
100 s
22.
A rocket traveled 90 meters in 45 seconds. How fast did it travel?
a)
2 km/s
b)
2 m/s
c)
5 m/s
d)
1 m/s
23.

Determine the speed at 20 seconds based on the information shown in the graph. Speed = distance/time
a)
2 m/s
b)
10 m/s
c)
20 m/s
d)
.5 m/s
24.
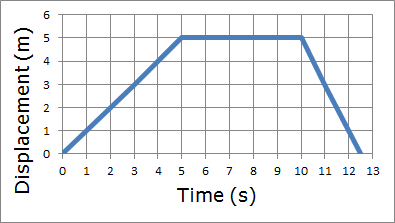
According to the graph how far does the person travel in the first 5 seconds?
a)
2 m
b)
10 m
c)
0 m
d)
5 m
25.

What is the person doing from 5 seconds to 10 seconds?
a)
Walking
b)
Running
c)
Standing Still
d)
Walking Fast
26.

What is the average speed of the person during the first 5 seconds?
a)
0 m/s
b)
1 m/s
c)
3 m/s
d)
6 m/s
27.

Which graph shows the fastest speed?
a)
A
b)
B
c)
C
d)
D
Reset

