
 Worksheets
H-R Diagram
Total questions: 15
Worksheet time: 12mins
Name
Class
Date
1.
Absolute magnitude is defined as...
a)
the brightness of an object in space, measured as if you’re 10 parsecs away from the object.
b)
Total energy emitted by a space object per unit time.
c)
the brightness of an object in space, as it appears from Earth
d)
the color of an object in space, described on a number scale.
2.
The effective temperature of a star is related to its...
a)
solar system
b)
luminosity
c)
absolute magnitude
d)
color
3.
The color index of a star provides information about that star’s
a)
age
b)
luminosity
c)
absolute magnitude
d)
temperature
4.

These are H-R Diagrams of different star clusters. Which one of these clusters is oldest and how do you know?
a)
The right; It has the highest proportion of stars that have become red giants.
b)
The middle; it has the highest proportion of stars in the main sequence.
c)
The right; It has the highest proportion of brown dwarf stars.
d)
The left; it has the highest number of blue giants.
5.

In which region of the H-R Diagram would you be likely to find Blue Giants?
a)
W
b)
X
c)
Y
d)
Z
6.

In which region of the H-R Diagram would you be likely to find the oldest stars?
a)
W
b)
X
c)
Y
d)
Z
7.
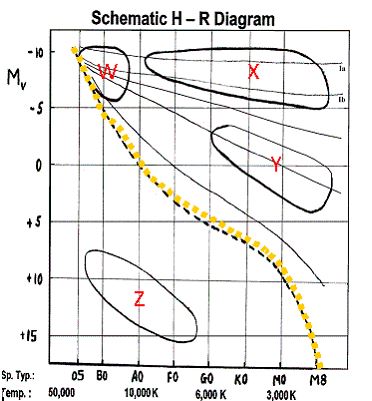
In which region of the H-R Diagram would you be likely to find stars fusing hydrogen to make helium in their cores?
a)
W
b)
X
c)
Y
d)
The orange dashed line
8.

In which region of the H-R Diagram would you be likely to find stars that are in hydrostatic equilibrium?
a)
W
b)
X
c)
Y
d)
The orange dashed line
9.

In which region of the H-R Diagram would you be likely to find the brightest, reddest stars?
a)
W
b)
X
c)
Y
d)
The orange dashed line
10.

What is the primary difference between a star of spectral class K0 in the Y region, compared to a star of spectral class K0 in the X region?
a)
temperature
b)
color
c)
brightness
d)
color index
11.

A Hertzsprung-Russell (H-R) diagram shows the relationship between ____.
a)
apparent magnitude and parallax
b)
parallax and temperature
c)
absolute magnitude and apparent magnitude
d)
temperature and absolute magnitude
12.

About 90 percent of stars on the H-R diagram are ____ stars.
a)
red giant
b)
main sequence
c)
luminosity
d)
supergiants
13.

Use the diagram to answer the question.Using the figure, Aldebaran, Mira, and Pollux are all _____ stars.
a)
giant
b)
supergiant
c)
main-sequence
d)
white dwarf
14.

Use the diagram to answer the question.Using the figure, which is a main-sequence star?
a)
Zeta Eridani
b)
Deneb
c)
Mira
d)
Sirius B
15.

Use the diagram to answer the question.Using the figure, which star is a supergiant?
a)
North Star
b)
Deneb
c)
Pollux
d)
Sirius B
100 %

