
 Worksheets
Box-and-Whiskers and Histogram Quick Check
Total questions: 18
Worksheet time: 2hrs 31mins
The data below show the donations, in dollars, a charity received from 8
of its donors at a fund-raising event.
640, 550, 480, 600, 720, 720, 800, 840
Which box plot correctly represents these data?


The data shows the average price of frozen orange juice at various times.
$1.83, $1.88, $1.83, $1.94, $2.54, $2.50, $2.46, $2.64, $2.73, $2.58
What are the three quartiles of the data?
Q1 = $1.83, Med = $2.52, Q3 = $2.64
Q1 = $1.83, Med = $2.48, Q3 = $2.58
Q1 = $1.88, Med = $2.52, Q3 = $2.64
Q1 = $1.88, Med = $2.48, Q3 = $2.58

What percentage of the data is between 90 and 140?
25 %
50%
75%
100%
What is the median of this data?
40
90
100
140
150

Which car club has the higher median?
Cruisers
Car Hops
Neither. Can't determine median from the graph.
What is the interquartile of this data?
50
90
110
100
If 60 values were used for the data, about how many data values are greater than the 1st quartile?
15
30
45
60
If I tell you that you scored at the 55th percentile on your final exam, you would know:
55% of the class scored the same or worse than you did
You earned a 55% on the exam
You failed the exam
45% of the class scored worse than you did
Find the 46th percentile of this set of 11 values
5, 12, 16, 18, 22, 25, 30, 31, 32, 33, 39
5.06
5
22
25
Given the data set: 1, 2, 3, 6, 9, 11, 45, 102, calculate the percentile for the data value 11 in this set.
70th percentile
62.5th percentile
72.5th percentile
75th percentile
A student recently took the SATs and their score correlated to the 60th percentile. This means that ______________ percent of all students score at or higher than the score the student received.
60
40
20
100

63
56
53
43


Which interval has 400 employees?
33-43
0-10
77-87
66-76

What percentage of students are between 60 and 63 inches tall?
25.9%
60%
14.9%
7%
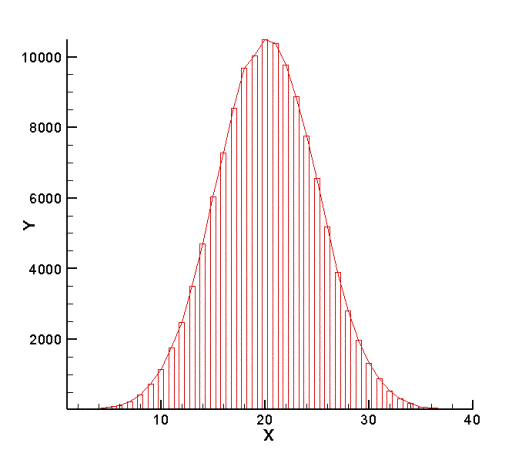
How would you describe this distribution?
Left skewed
Uniform
Right Skewed
Symmetrical

What is the shape of the data?
left skewed
symmetrical
right skewed

To create a histogram for this data, what would go along the x-axis?
Frequency
Science
Number of students

