
 Worksheets
Speed and Motion Graphs
Total questions: 35
Worksheet time: 1hrs 7mins
Name
Class
Date
1.

What is the speed of an object that travels 60 meters in 4 seconds?
a)
240 m/s
b)
15 m/s
c)
0.067 m/s
d)
15 mph
2.

What is this objects speed at 2 s?
a)
5 m/s
b)
5 s/m
c)
20 m/s
d)
20 s/m
3.

What is the speed of this object at 3 seconds?
a)
5 m/s
b)
45 m/s
c)
5 s/m
d)
45 s/m
4.

What is the speed of a cheetah that travels 112.0 m in 4.0 s?
a)
0.0357 m/s
b)
28.0 km/s
c)
0.036 m/s
d)
28.0 m/s
5.
The unit for speed is:
a)
m/s
b)
s
c)
m
d)
km
6.
The unit for distance is:
a)
m
b)
s
c)
m/s
7.
The unit for time is:
a)
s
b)
m
c)
m/s
8.
Find the velocity of a plane that traveled 3000 miles west in 5 hours.
a)
65 mph west
b)
6 mph west
c)
600 mph west
d)
6000 mph west
9.
Velocity is both ____ and _____.
a)
speed , direction
b)
direction, mass
c)
volume, density
d)
direction, magnitude
10.
65mi/hr South is an example of...
a)
Speed
b)
Velocity
c)
Acceleration
d)
Direction
11.

A proper quantity showing velocity would be
a)
25 m/s.
b)
30 m south.
c)
15 m/s north.
d)
10 m.
12.

A speedometer shows a "snapshot" or "freeze frame" of a car's motion. This is called
a)
instantaneous speed.
b)
average speed.
c)
velocity.
d)
displacement.
13.
On a distance vs. time graph, the steeper the slope _____
a)
the slower the speed
b)
the faster the speed
c)
less acceleration
d)
greater acceleration
14.

What does this graph represent?
a)
Constant speed
b)
Acceleration
c)
Not moving
15.

According to the graph how far does the person travel in the first 5 seconds?
a)
2 m
b)
10 m
c)
0 m
d)
5 m
16.

At 60 seconds, how far had this object traveled?
a)
0 m
b)
10 m
c)
20 m
d)
40 m
17.
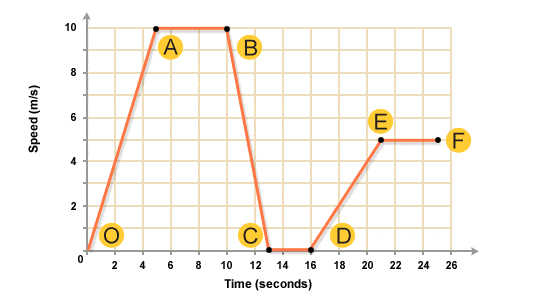
What is happening in this graph from point B to C?
a)
The object is going down a hill.
b)
The object is returning to its starting location.
c)
The object is slowing down.
d)
The object is staying still.
18.
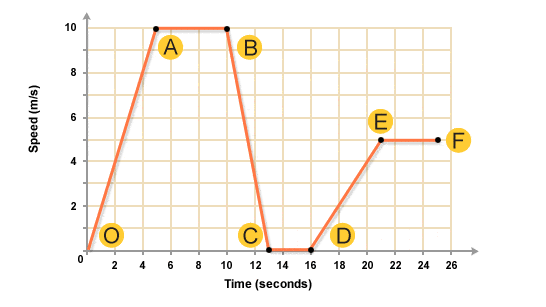
What is happening in this graph from point A to B?
a)
The object is accelerating.
b)
The object is not moving.
c)
The object is decelerating.
d)
The object is moving at a constant speed.
19.

What does this graph represent?
a)
Constant speed
b)
Acceleration
c)
Not moving
20.

A box sliding down an inclined plane attains a velocity of 27 m/s in 3 seconds from rest. Find the acceleration.
a)
30 m/s
b)
24 m/s2
c)
9 m/s2
d)
81 km/hr
21.
A rocket traveling faster and faster in a straight line is NOT changing its....
a)
mass
b)
momentum
c)
energy
d)
direction
22.

Which is an example of a car NOT accelerating?
a)
moving at 80km/h on a flat, straight highway
b)
slowing down to round a corner
c)
speeding up to win the race
d)
crossing the finish line and pulling into the pit
23.
Acceleration can be classified as _______________
a)
Speeding up
b)
Slowing Down
c)
Changing directions
d)
All of the above
24.
In order to determine speed, you must know ____________
a)
time
b)
distance
c)
both time and distance
d)
neither time nor distance
25.

What happened during A to B point?
a)
not moving
b)
increasing speed at a constant rate
c)
moving at a constant speed
d)
moving at 10 m/s2 acceleration
26.

What is the speed this motion?
a)
constant speed
b)
not moving
c)
speed increasing
d)
speed increasing at a constant rate
27.

What happened during C to D point?
a)
not moving
b)
increasing speed at a constant rate
c)
moving at a constant speed
d)
moving at 0 m/s2 acceleration
28.

What happened during E to F point?
a)
not moving
b)
increasing speed at a constant rate
c)
moving at a 5 m/s
d)
moving at 5 m/s2 acceleration
29.

What happened during A to B point?
a)
all of above
b)
moving at a constant speed
c)
moving at a 10 m/s
d)
moving at 0 m/s2 acceleration
30.

What does this graph represent?
a)
Constant Speed
b)
Acceleration
c)
Not moving
31.

During which interval are the forces on the object BALANCED (Net Force= 0 N)?
a)
A to B
b)
B to C
c)
D to E
d)
F to G
32.

During which interval are the forces on the object UNBALANCED?
a)
B to C
b)
C to D
c)
D to E
d)
none of these
33.
Acceleration: is the rate of change in ___________.
a)
speed
b)
distance
c)
velocity
d)
displacement
34.

Which runner won the race?
a)
A
b)
B
c)
C
35.

Every morning, Tom walks along a straight road from his home to the bus stop. Below, is a graph representing Tom’s trip to school.
- What is the average speed of Tom’s complete journey?
- What is the average speed of Tom’s complete journey?
a)
1.6 m/s
b)
1.3 m/s
c)
2.3 m/s
d)
2.8 m/s
100 %

