
NEW
Font size
S
M
L
XL
 Worksheets
Mod 2 Review
Total questions: 14
Worksheet time: 18mins
Name
Class
Date
1.

Is the Cars dot plot skewed left or right?
a)
left
b)
right
2.

What type of association does this scatter plot show?
a)
positive linear association
b)
negative linear association
c)
no association
d)
nonlinear association
3.

What is the type of association (correlation)?
a)
Negative
b)
no association
c)
positive
4.

Which scatter plot shows a linear relationship between x and y?
a)
Graph A
b)
Graph B
c)
Graph C
d)
Graph D
5.

The scatter plot below shows the number of books read by students in Mrs. Hall’s English class and their final grades. Which statement represents the best description about the line of best fit?
a)
The more books students read, the lower their English grade.
b)
The more books students read, the higher their English grade.
c)
The fewer books students read, the higher their English grade.
d)
No relationship exists between the number of books students read and their English grades.
6.

What type of association does this graph show?
a)
Positive
b)
negative
c)
none
d)
all of the above
7.
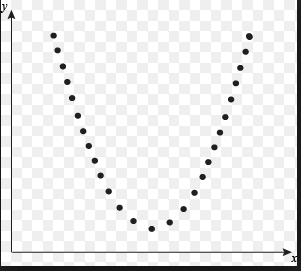
What type of association does this scatter plot represent?
a)
Linear
b)
Exponential
c)
Quadratic
d)
No Relationship
8.
Scatterplots show trends in data.
a)
True
b)
False
9.

Which of the following lines represents the line of best fit for the scatter plot?
a)
A
b)
B
c)
C
d)
D
10.
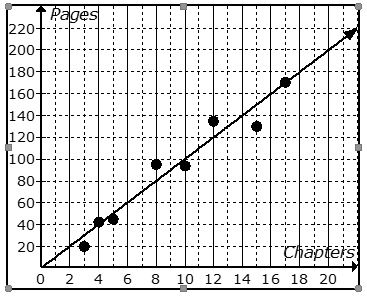
The scatter plot shows the relationship between the number of chapters and the total number of pages for several books. Use the trend line to predict how many chapters would be in a book with 180 pages.
a)
12 chapters
b)
15 chapters
c)
18 chapters
d)
21 chapters
11.

Which of the following could be a possible line of best fit for the data?
a)
y = 3x + 0
b)
y = 5/6x + 490
c)
y = -2x + 470
d)
non linear
12.

The linear regression equation is y = 61.93x - 1.79. Use the equation to predict how far this person will travel after 10 hours of driving.
a)
10 miles
b)
617.5 miles
c)
0.19 miles
d)
500 miles
13.

The linear regression equation for the data is y = 1.5x + 12. Use the equation to predict the cost of a pizza that has 8 toppings.
a)
$8
b)
$12
c)
$24
d)
$28
14.
8. Find the mean.
120, 120, 90, 70
120, 120, 90, 70
a)
120
b)
400
c)
200
d)
100
Reset

