
 Worksheets
7th Math 9.1 -9.4 Review
Total questions: 35
Worksheet time: 2hrs 33mins
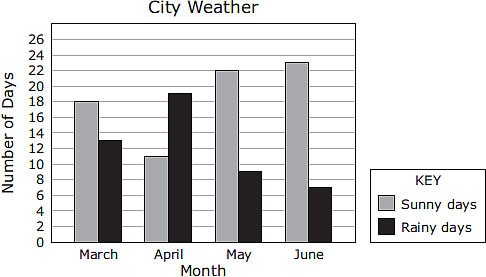
Based on the graph,how many more sunny days than rainy days did this city have during the months of April, May, and June?
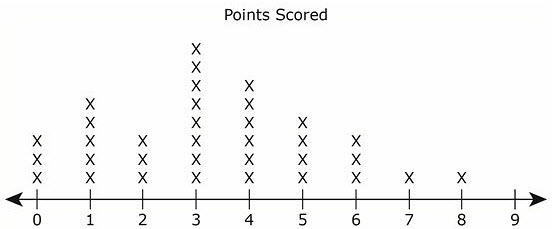
What is the difference between the number of players who scored fewer than 4 points and the number of players who scored more than 4 points?
All 25 students in a class were surveyed about their favorite food. 11 students chose pizza. What percentage of the class chose pizza?
20%
44%
15%
60%


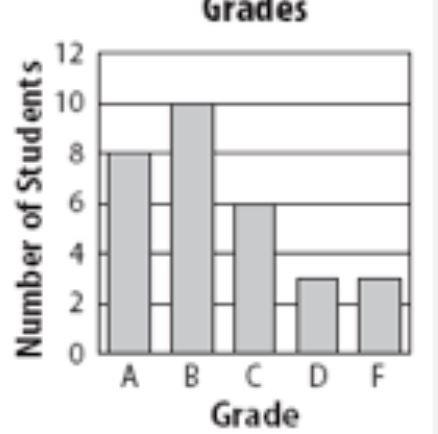
How many more students scored B's than A's?
8
10
18
2

If there are 300 seventh graders, how many students prefer choir?
96
24
75
32

What fraction of the students students spent 7 hours doing homework that week?
7/20
7
3/10
6




If 500 total tickets were sold, how many tickets were sold to students?
55 tickets
120 tickets
225 tickets
275 tickets
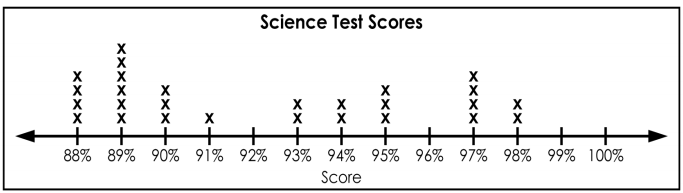


Callie conducted a survey to determine students' favorite color. Of the students surveyed, 18 out of 48 preferred blue. If there are 600 students in her school, how many would you expect to prefer blue?
225
320
200
240
Suppose 7/10 of people surveyed agree that dogs are the best pets to own. How many people out of 500 would you expect to say they DO NOT think dogs are the best pet?
350
200
250
150
In a sample of people in the school district, 16 out of 25 favored building a new football stadium. If 6,000 people vote in the next local election, how many are likely to vote in favor of the new football stadium based on this sample?
2,980
3,840
2,160
In a class of 25 students, 40% have been to England. How many students have NOT been to England?
10
15
20
30
60% of them were female.
How many were female?
To determine whether the students will attend an arts festival at the school, Oliver surveys his friends in the art club. All of Oliver's friends plan to attend. So, Oliver assumes that all of the students at his school will also attend.
Determine if the conclusion is valid.
To evaluate the quality of their product, a manufacturer of cell phones checks every 50th phone off the assembly line. Out of 200 phones tested, 4 are defective. The manager concludes that about 2% of the cell phones will be defective.
The conclusion is valid
The conclusion is not valid

The dot plot shows the number of magazines sold by students in a homeroom. What fraction of the students who sold magazines sold 20 magazines?
1/3
1/6
1/4
1/12

The dot plot shows the ages of people in a play. Compare the number of people in the play who are 19 years or older to the number of people who are less than 19 years old.
There were 1.8 times as many people who are 19 years or older than those who are less than 19 years old.
There were 1.2 times as many people who are 19 years or older than those who are less than 19 years old.
There were .8 times as many people who are 19 years or older than those who are less than 19 years old.
There were 1.5 times as many people who are less than 19 years old than those who are 19 years old or older.

The circle graph shows the results of a survey about favorite sports. Suppose 150 people were surveyed. How many more people favor basketball than tennis?
20
15
45
30

The circle graph shows the results of a survey about favorite sports. Suppose 250 people were surveyed. How many more total people were surveyed than those who favor basketball?
75
150
175
200
To determine what students want served in the cafeteria, the cook asks students in Mrs. Smith's first period class. Describe the sample used by the cook.
The sample is biased because it is a convenience sample
The sample is unbiased because it is a voluntary response sample.
The sample is unbiased because it is a convenience sample.
The sample is unbiased because it is a simple random sample.
To determine who the voters will choose for governor, five voters picked at random from each county of the state are surveyed. Describe the sample.
The sample is biased because it is a convenience sample.
The sample is unbiased because it is a voluntary response sample.
The sample is biased because it is a systematic random sample.
The sample is unbiased because it is a simple random sample.

