
 Worksheets
Graphing Review
Total questions: 49
Worksheet time: 2hrs 55mins
Name
Class
Date
1.

How many more people like basketball than football?
a)
10
b)
5
c)
15
d)
20
2.

What was the day with the least amount of cars sold?
a)
Monday
b)
Tuesday
c)
Wednesday
d)
Thursday
3.

Add the number of cars sold on Monday and Tuesday. Add the number of cars sold on Friday and Saturday. What was the difference between the number of cars sold on Monday and Tuesday than the number of cars sold on Friday and Saturday.
a)
1
b)
2
c)
3
d)
4
4.

Which three ages combined have the highest number of students.
a)
6.7.8
b)
8,9,10
c)
10,11,12
d)
4,5,6
5.

According to the two-way table, a person who plays an instrument is most likely to:
a)
Not play an instrument
b)
Not play a team sport
c)
Play a team sport
d)
All of the above
6.

What type of graph is this?
a)
Bar Graph
b)
Line Plot
c)
Pictograph
d)
Tally Chart
7.

How many votes did reading and social studies receive together?
a)
9
b)
11
c)
13
d)
15
8.

How many more people like purple than red?
a)
3
b)
5
c)
7
d)
9
9.

How many votes did reading receive?
a)
2
b)
4
c)
6
d)
8
10.

How many total people took the survey?
a)
50
b)
150
c)
100
d)
200
11.

How many people use AT&T and Sprint as their cell-phone provider?
a)
11
b)
2
c)
13
d)
15
12.

How many people like basketball and football in all?
a)
10
b)
15
c)
20
d)
4
13.

How many sophomores like burritos and pizza?
a)
6
b)
5
c)
11
d)
50
14.

Which graphs shows nickels at 13, dimes at 9, and quarters at 17.
a)
Graph 1
b)
Graph 2
c)
Graph 3
d)
Graph 4
15.

Which graph matches the data?
a)
Graph 1
b)
Graph 2
c)
Graph 3
d)
Graph 4
16.

How many children like green?
a)
100
b)
10
c)
2
d)
5
17.

What type of graph is this?
a)
Bar Graph
b)
Line Plot
c)
Pictograph
d)
Tally Chart
18.

How many more people have purple for a favorite color than red?
a)
3
b)
5
c)
7
d)
9
19.

Which sport is the least favorite?
a)
baseball
b)
football
c)
hockey
d)
basketball
20.

How many fewer people liked hockey than football?
a)
3
b)
5
c)
8
d)
11
21.

How many total votes were collected?
a)
5
b)
10
c)
15
d)
20
22.
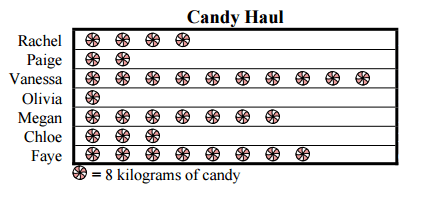
Who has the least candy?
a)
Olivia
b)
Megan
c)
Chole
d)
Faye
23.

How many cars were sold on Saturday and Sunday?
a)
5
b)
3
c)
8
d)
10
24.

How many students had more than 6 candy bars?
a)
5
b)
2
c)
3
d)
1
25.

How many cars were sold on Monday and Tuesday?
a)
13
b)
5
c)
11
d)
2
26.

How many kids wore walking shoes to school today?
a)
7
b)
10
c)
9
d)
6
27.

How many people had 3 pets?
a)
5
b)
7
c)
4
d)
3
28.

How many students received a score in the 80's?
a)
2
b)
10
c)
14
d)
27
29.
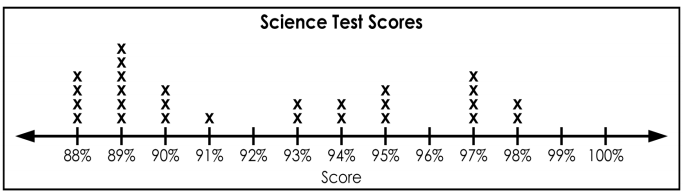
What is the highest score in the class?
a)
88%
b)
100%
c)
13
d)
98%
30.

How many students received a score of 94%?
a)
94
b)
4
c)
1
d)
2
31.

How many students have 0 Brothers and Sisters?
a)
6 students
b)
0 students
c)
12 students
d)
10 students
32.

How many students have 1 Brother and Sister?
a)
10 students
b)
5 students
c)
7 students
d)
2 students
33.

Each dot represents 1 day. How many days were recorded?
a)
9
b)
21
c)
20
d)
105
34.

How many pages in chapter 2?
a)
1
b)
5
c)
3
35.
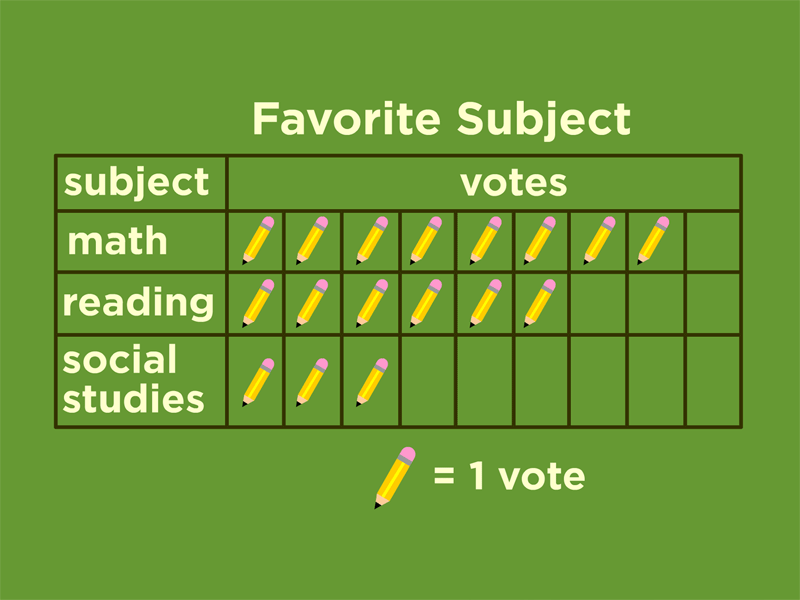
Which subject received the most votes?
a)
science
b)
reading
c)
social studies
d)
math
36.
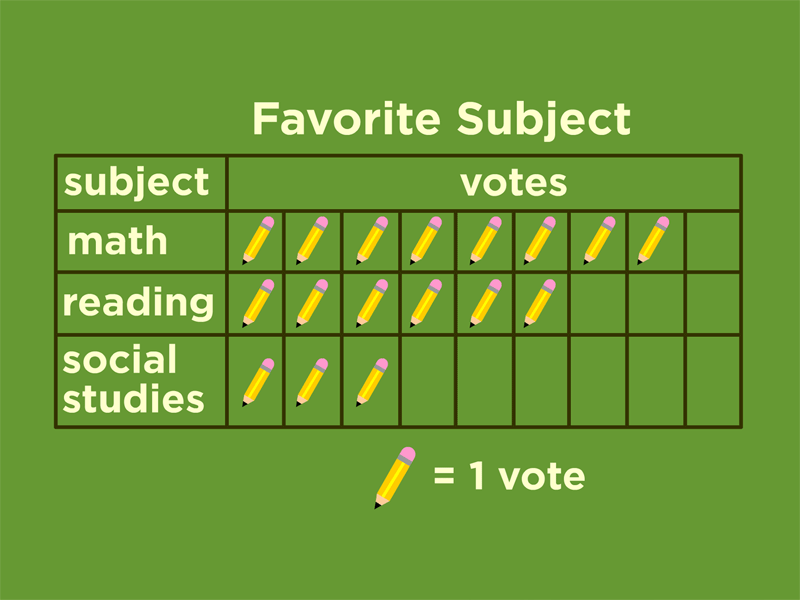
How many votes did reading receive?
a)
2
b)
4
c)
6
d)
8
37.

How many votes did reading and social studies receive together?
a)
9
b)
11
c)
13
d)
15
38.

How many total votes were collected?
a)
5
b)
10
c)
15
d)
20
39.

How many more Tulips than Roses?
a)
3
b)
9
40.

How many fewer Tulips than Daisies?
a)
19
b)
5
41.

How many Lilies and Roses?
a)
14
b)
11
42.

How many Pizza and Hot Dogs?
a)
8
b)
11
43.
How many total people took the survey?
a)
50
b)
150
c)
100
d)
200
44.

Which questions can be answered by this bar graph?
a)
Which sport did girls like to play?
b)
Where were the sports played?
c)
How many more students like basketball than softball?
d)
What are the other types of sports that students liked?
45.

How many more kids liked hamburgers more than chicken?
a)
12
b)
9
c)
11
46.

Eric asked some friends to name their favorite sandwich. Which bar graph is correct?
a)
b)
c)
d)
47.

Tap on all the choices that describe the data above
a)
6 friends chose ham
b)
Turkey was chosen by the most friends.
c)
7 friends chose cheese and jelly together
d)
5 more friends chose turkey than cheese.
48.

Joe read for 5 hours in Week 1, 3 hours in Week 2, and 2 hours in week 3. Which bar graph shows this data?
a)
A
b)
B
49.

Which table shows the same data?
a)
b)
100 %

