
 Worksheets
Statistics
Total questions: 37
Worksheet time: 2hrs 30mins
Name
Class
Date
1.
Is the following question statistical or non statistical?
How many cars are in the parking lot?
How many cars are in the parking lot?
a)
Statsitical
b)
Non Statistical
2.
Is the following question statistical or non statistical?
What pets does our class have?
What pets does our class have?
a)
Statistical
b)
Non statistical
3.
Is the following question statistical or non statistical?
How many lanterns are hanging in our classroom
How many lanterns are hanging in our classroom
a)
Statistical
b)
Non Statistical
4.
Is the following question statistical or non statistical?
How many siblings do each student have?
a)
Statistical
b)
Non Statistical
5.

At Dominique's Donuts the number of donut holes in a bag can vary. Help Dominique find the mode.
12,10,10,10,13,12,11,13,10
12,10,10,10,13,12,11,13,10
a)
13
b)
12
c)
11
d)
10
6.
Ervin bowled 7 games last weekend. His scores are: 155, 165, 138, 172, 127, 193, 142. What is the range of Ervin's scores?
a)
193
b)
127
c)
60
d)
66
7.
What is the mode?
a)
# happening the most
b)
the average
c)
biggest - smallest
d)
the middle #
8.
Find the mean of these numbers:
5,11,2,12,4,2
5,11,2,12,4,2
a)
4.1
b)
6
c)
4.5
d)
4
9.
Find the median of these numbers:
4,2,7,4,3
4,2,7,4,3
a)
2
b)
5
c)
7
d)
4
10.
Find the median, mode and range:
3, 5, 7, 9, 11, 8, 3
3, 5, 7, 9, 11, 8, 3
a)
median:7 mode:3 range:7
b)
median:6 mode:3 range:7
c)
median:7 mode:3 range:8
11.
Find the mean of these numbers:
2, 57, 38, 42, 6
2, 57, 38, 42, 6
a)
29
b)
38
c)
50
d)
145
12.
To find the mean of a set of numbers, add up all the items and divide by...
a)
2
b)
The minimum
c)
The maximum
d)
The number of items
13.
In order to find the median, the data must be sorted from least to greatest first.
a)
True
b)
False
14.
What is the range?
a)
average
b)
biggest-smallest
c)
the middle #
d)
# happening the most
15.
Find the range.
7, 1, 1, 7, 1, 4, 1
7, 1, 1, 7, 1, 4, 1
a)
6
b)
5
c)
7
d)
3
16.
Find the median.
12, 5, 9, 18, 22, 25, 5
12, 5, 9, 18, 22, 25, 5
a)
9
b)
8
c)
12
d)
18
17.
The number of miles that Kiki cycled each week for a 7-week period is shown:
36, 42, 28, 52, 48, 36, 31
What is the median number of miles Kiki cycled?
36, 42, 28, 52, 48, 36, 31
What is the median number of miles Kiki cycled?
a)
24
b)
36
c)
39
d)
52
18.
Find the mean.
90, 100, 95, 85, 60, 80
90, 100, 95, 85, 60, 80
a)
85
b)
84
c)
86
d)
90
19.
The number of pages that Carolyn wrote in her journal each day from Monday to Friday is shown below:
9, 8, 12, 6, 10
What is the mean number of pages she wrote per day?
9, 8, 12, 6, 10
What is the mean number of pages she wrote per day?
a)
5
b)
6
c)
9
d)
11
20.

Dr. Dre is a dentist. He needs to report on the average number of cavities that his patients have.
1,0,1,5,6,3,4
1,0,1,5,6,3,4
a)
3.33
b)
2.85
c)
3
d)
3.5
21.
The heights of some students are given.
158cm 172cm 164cm
164cm 167cm 159cm
What is the range of the heights?
158cm 172cm 164cm
164cm 167cm 159cm
What is the range of the heights?
a)
13cm
b)
14cm
c)
164cm
d)
330cm
22.
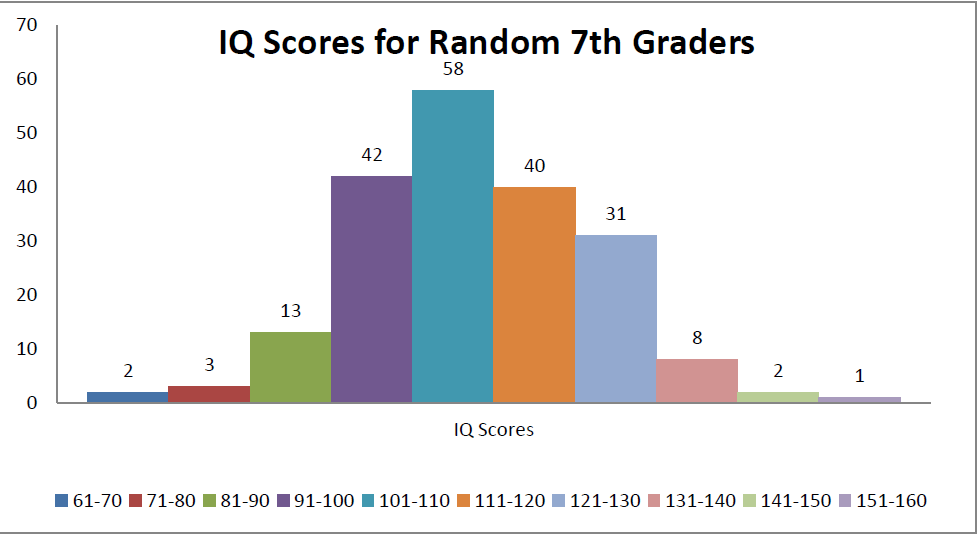
How many 7th graders had an IQ score in the 81-90 range?
a)
13
b)
6.5
c)
3
d)
42
23.
What was the most common IQ range?
a)
91-100
b)
111-120
c)
12-130
d)
101-110
24.

What was the day with the least amount of cars sold?
a)
Monday
b)
Tuesday
c)
Wednesday
d)
Thursday
25.

How many cars were sold on Monday and Tuesday?
a)
13
b)
5
c)
11
d)
2
26.

What is the interquartile range (IQR) of this data?
a)
2
b)
7.25
c)
9.5
d)
2.25
27.

What is the interquartile range (IQR) of this data?
a)
7
b)
12
c)
13
d)
8
28.

What is the interquartile range (IQR)?
a)
4
b)
64
c)
60
d)
8
29.

What value is the lower quartile?
a)
66
b)
58
c)
60
d)
64
30.

Which interval has the highest frequency?
a)
9 - 10 books
b)
7-8 Books
c)
5-6 Books
d)
3-4 Books
31.

Describe the shape of the graph.
a)
Skewed right
b)
Skewed left
c)
Random
d)
Symmetrical
32.
A data set can have more than one median?
a)
True
b)
False
33.
33, 25, 42, 25, 31, 37, 46, 29, 38
What is the third quartile of the data?
What is the third quartile of the data?
a)
37
b)
38
c)
40
d)
46
34.

Based on the line plot, how many students ate 5 candy bars?
a)
4
b)
3
c)
8
d)
0
35.
What does it mean for a graph of data to be SYMMETRICAL?
a)
Most of the data is grouped to the left side
b)
Most of the data is grouped to the right side
c)
Most of the data is in the middle
(draw a line down the middle and both sides look the same)
(draw a line down the middle and both sides look the same)
36.
What does it mean for a graph of data to be SKEWED LEFT?
a)
Most of the data is grouped to the left side
b)
Most of the data is grouped to the right side
c)
Most of the data is in the middle
(draw a line down the middle and both sides look the same)
(draw a line down the middle and both sides look the same)
37.
What does it mean for a graph of data to be SKEWED RIGHT?
a)
Most of the data is grouped to the left side
b)
Most of the data is grouped to the right side
c)
Most of the data is in the middle
(draw a line down the middle and both sides look the same)
(draw a line down the middle and both sides look the same)
100 %

