
 Worksheets
Module 7 CBA
Total questions: 111
Worksheet time: 27hrs 35mins
Name
Class
Date
1.

What is the range in heights represented in this dot plot?
a)
12
b)
66
c)
65
d)
66
2.

Which statement is best supported by the dot plot?
a)
The Mode of this set of data is 72.
b)
The range of this set of numbers is 72.
c)
The median for this set of numbers is 65.
d)
The Mean for this set of numbers is 57.
3.

Which statement about the data is true?
a)
The median is 65, and the IQR is 2.
b)
The range is 12 and the IQR is 4.
c)
The Mode is 65 and the range is 11.
d)
The mean is 67 and the mode is 67.
4.

Which statement about the data in the dot plot is true?
a)
The distribution of the data is asymmetrical, so the mean and median are likely within the "65-67 range."
b)
The distribution of the data is symmetrical, so the mean and median are likely in the "65-66" range.
c)
The distribution of the data is symmetrical, so the mean and median are likely within the "63-65" range.
d)
The distribution of the data is asymmetrical, so the mean and median are likely within the "63-65" range.
5.

Using this graph, describe the data that would be used in a box plot.
a)
The minimum would be 60, the maximum would be 72, and the median would be 64.
b)
The IQR would be 4 and the median would be 65.
c)
The range would be 12 and the IQR would be 12.
d)
The median would be 4 and the IQR would be 65.
6.
Which number represents the mode? 8,10,12,14,16,18,20,16
a)
10
b)
16
c)
no mode
d)
18
7.
Which number represents the median? 45,61,48,56,52,58,46
a)
48
b)
56
c)
52
d)
46
8.
To find the mean (average) of a set of numbers, add up all the items and divide by...
a)
2
b)
The minimum
c)
The maximum
d)
The number of items
9.

Dr. Brown is a dentist. He needs to report on the mean (average) number of cavities that his patients have.
1,0,1,5,6,3,4
1,0,1,5,6,3,4
a)
3.33
b)
2.85
c)
3
d)
3.5
10.
What is the range in this set of numbers:
7, 14, 22, 3, 7, 14, 2, 14, 7
7, 14, 22, 3, 7, 14, 2, 14, 7
a)
7
b)
20
c)
18
d)
none of the above
11.
What do you need to do FIRST to the data set?
a)
leave them like they are
b)
order the data set from least to greatest
c)
order the data set from greatest to least
12.

What percentage of students are 52-55 inches tall and 60-63 inches tall? (How many students fall into those categories out of all students combined?)
a)
60%
b)
50%
c)
5%
d)
100%
13.
Which data display best displays the following:
least value, greatest value, median, lower quartile, upper quartile?
least value, greatest value, median, lower quartile, upper quartile?
a)
Box and Whisker
b)
Line Graph
c)
Histogram
d)
Stem and Leaf
14.

Which city shows the lower IQR?
a)
City A
b)
City B
15.

What is the mean of the scores?
a)
17.5
b)
29.5
c)
19
d)
18
16.

What is the range of this data? Is the display symmetrical?
a)
20; no
b)
20; yes
c)
40; yes
d)
40; no
17.

6.12(A) 2016
a)
A
b)
B
c)
C
d)
D
18.

6.12(A) 2014
a)
A
b)
B
c)
C
d)
D
19.

6.12(A) 2014
a)
F
b)
G
c)
H
d)
J
20.

6.12(A) 2013 Q10
a)
F
b)
G
c)
H
d)
J
21.

6.12(B) 2017
a)
A
b)
B
c)
C
d)
D
22.

6.12(C) 2017
a)
687
b)
517
c)
444
d)
671
23.

6.12(C) 2016
a)
A
b)
B
c)
C
d)
D
24.

6.12(C) 2016
a)
F
b)
G
c)
H
d)
J
25.

6.12(C) 2015
a)
A
b)
B
c)
C
d)
D
26.

6.12(C) 2013 Q41
a)
A
b)
B
c)
C
d)
D
27.

6.12(D) 2017
a)
F
b)
G
c)
H
d)
J
28.

6.12(D) 2016
a)
A
b)
B
c)
C
d)
D
29.

6.12(D) 2016
a)
A
b)
B
c)
C
d)
D
30.

6.12(D) 2015
a)
A
b)
B
c)
C
d)
D
31.

6.13(A) 2017
a)
F
b)
G
c)
H
d)
J
32.

6.13(A) 2017
a)
F
b)
G
c)
H
d)
J
33.

6.13(A) 2016
a)
F
b)
G
c)
H
d)
J
34.

6.13(A) 2016
a)
A
b)
B
c)
C
d)
D
35.

6.13(A) 2015
a)
A
b)
B
c)
C
d)
D
36.

6.13(B) 2015
a)
A
b)
B
c)
C
d)
D
37.
Clayton plays basketball on a team. He has played three
games so far. In the first game, he scored 10 points. In
the second game, he scored 14 points. In the third game,
he scored 6 points. What is Clayton's average points per
game?
games so far. In the first game, he scored 10 points. In
the second game, he scored 14 points. In the third game,
he scored 6 points. What is Clayton's average points per
game?
a)
30
b)
12
c)
3
d)
10
38.

At Dominique's Donuts the number of donut holes in a bag can vary. Help Dominique find the mode.
12,10,10,10,13,12,11,13,10
12,10,10,10,13,12,11,13,10
a)
13
b)
12
c)
11
d)
10
39.
Ervin bowled 7 games last weekend. His scores are: 155, 165, 138, 172, 127, 193, 142. What is the range of Ervin's scores?
a)
193
b)
127
c)
60
d)
66
40.
What is the mode?
a)
# happening the most
b)
the average
c)
biggest - smallest
d)
the middle #
41.
A data set can have more than one mode
a)
True
b)
False
42.

What is the median of the data?
a)
200
b)
100
c)
90
d)
140
43.

Which restaurant has a higher median wait time?
a)
Lucy's Steakhouse
b)
Gary's Grill
c)
They are the same
44.

What is the minimum value?
a)
64
b)
58
c)
66
d)
60
45.

How many total people took the survey?
a)
50
b)
150
c)
100
d)
200
46.

What is the range of the data?
a)
4
b)
8
c)
6
d)
2
47.

6.12 D
Mrs. Reynolds plants several different colored roses. If all of the rose plants bloom, she will have 2 yellow, 7 red, 5 pink, 7 white, and 4 orange rose plants.
Which color of rose represents the mode?
Mrs. Reynolds plants several different colored roses. If all of the rose plants bloom, she will have 2 yellow, 7 red, 5 pink, 7 white, and 4 orange rose plants.
Which color of rose represents the mode?
a)
Red only
b)
Red and pink only
c)
White only
d)
White and red only
48.

6.12 D
The farmers market conducts a survey to determine the favorite local produce. The results are shown in the graph below.
Which statement is true about the distribution of the data?
The farmers market conducts a survey to determine the favorite local produce. The results are shown in the graph below.
Which statement is true about the distribution of the data?
a)
Tomatoes and onions were selected as the favorite produce by over half of the people surveyed.
b)
Tomatoes represent the mode for the data.
c)
Of the people surveyed, 9/20 chose peas as their favorite.
d)
Cucumbers were selected as the favorite produce by 45% of the people surveyed.
49.

6.12 C
Mr. Miller shops for a new printer. He searches the local ads for printers and records the prices as shown.
$150, $129, $79, $145, $136, $140, $130
What value best describes the median?
Mr. Miller shops for a new printer. He searches the local ads for printers and records the prices as shown.
$150, $129, $79, $145, $136, $140, $130
What value best describes the median?
a)
$129
b)
$145
c)
$136
d)
$140
50.

6.12 C
Mr. Brooks held audition for the school musical each afternoon. The data below shows the number of students who auditioned each day.
22, 18, 20, 26, 24, 2, 18, 21
What correctly describes the spread of the data?
Mr. Brooks held audition for the school musical each afternoon. The data below shows the number of students who auditioned each day.
22, 18, 20, 26, 24, 2, 18, 21
What correctly describes the spread of the data?
a)
Range = 24
IQR = 20.5
IQR = 20.5
b)
Range = 21
IQR = 5
IQR = 5
c)
Rangle = 24
IQR = 5
IQR = 5
d)
Range = 20.5
IQR = 21
IQR = 21
51.

6.13 A
The number of students in Mr. Mack's first period that scored between 78 and 90 on the unit test represent what percent of his students?
The number of students in Mr. Mack's first period that scored between 78 and 90 on the unit test represent what percent of his students?
a)
25%
b)
50%
c)
75%
d)
100%
52.

6.13 A
Mrs. Beck shops from the clearance rack of dresses. The stem-and-leaf plot represents the sale prices of dresses in Mrs. Beck's size. Which statement is true?
Mrs. Beck shops from the clearance rack of dresses. The stem-and-leaf plot represents the sale prices of dresses in Mrs. Beck's size. Which statement is true?
a)
Twenty percent of the dresses cost more than $50.
b)
On-fifth of the dresses range in price from $30 to $40.
c)
Fifteen percent of the dresses cost less than $20.
d)
Four percent of the dresses cost $65.
53.

How many total students are in the science class?
a)
13
b)
6
c)
27
d)
25
54.

How many students scored between 95 and 100?
a)
6
b)
6
c)
9
d)
14
55.

What is the difference between the highest score and the lowest score on the test?
a)
15
b)
100
c)
6
d)
10
56.

Are these dot plots symmetric?
a)
Yes
b)
No
57.

50% of the Cruisers attended between 7 and 16 car shows. True or False?
a)
True
b)
False
58.

What shape is the data shown in the dot plot?
a)
symmetrical
b)
skewed left
c)
skewed right
59.

How many more students like soccer than basketball?
a)
24
b)
15
c)
10
d)
17
60.

About what percent of the people live in Friendship? (Rounded to the nearest whole number)
a)
46%
b)
100%
c)
25%
d)
34%
61.
Roger bowled 7 games last weekend. His scores are: 155, 165, 138, 172, 127, 193, 142. What is Roger's median score?
a)
127
b)
155
c)
156
d)
193
62.
33, 25, 42, 25, 31, 37, 46, 29, 38
What is the third quartile (UQ) of the data?
What is the third quartile (UQ) of the data?
a)
37
b)
38
c)
40
d)
46
63.

What percentage of the data is between 40 and 150?
a)
25 %
b)
50%
c)
75%
d)
100%
64.

Describe the shape of Daniel's data
a)
skewed left
b)
skewed right
c)
symmetrical
65.

What is the approximate difference in the interquartile ranges?
a)
20
b)
12
c)
32
d)
40
66.

Consider the boxplot below. What is the range?
a)
4
b)
3.5
c)
9
d)
11
67.

What is the highest score in the class?
a)
88%
b)
100%
c)
13
d)
98%
68.

What is the range in gas mileage for SUVs?
a)
2
b)
3
c)
4
d)
6
69.

How many people have two or less books in their desk?
a)
4
b)
5
c)
6
d)
7
70.

The graph below shows the number of sunny days and rainy days in a city during four months.
Based on the graph,how many more sunny days than rainy days did this city have during the months of April, May, and June?
Based on the graph,how many more sunny days than rainy days did this city have during the months of April, May, and June?
a)
21
b)
56
c)
26
d)
20
71.

What is the difference between the highest score and the lowest score on the test?
a)
15
b)
100
c)
6
d)
10
72.

The dot plot below shows the points scored by players in a basketball game.
What is the difference between the number of players who scored fewer than 4 points and the number of players who scored more than 4 points?
What is the difference between the number of players who scored fewer than 4 points and the number of players who scored more than 4 points?
a)
4 players
b)
10 players
c)
13 players
d)
15 players
73.

How many students received a score in the 80's?
a)
2
b)
10
c)
14
d)
27
74.
What is the difference between the highest score and the lowest score on the test?
a)
15
b)
100
c)
6
d)
10
75.
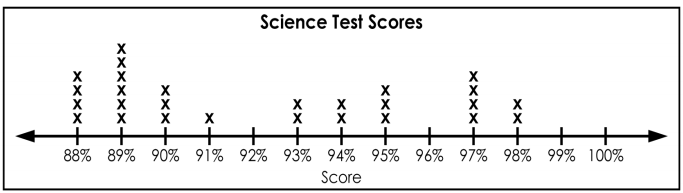
How many more students scored a 98 than scored a 88?
a)
4
b)
2
c)
6
d)
35
76.

How many scores are listed in this Stem and Leaf Plot?
a)
3
b)
6
c)
9
d)
18
77.

In how many games did the team score fewer than 10 points?
a)
3
b)
5
c)
4
d)
6
78.

Which statement best describes the trend in the data?
a)
As temperatures increase, ice cream cone sales increase.
b)
As temperatures increase, ice cream cone sales decrease.
c)
As temperatures decrease, ice cream cone sales increase.
d)
There is no trend in the data.
79.

Jorge made a dot plot of the distances he walked for the past 10 days. What is the difference between the longest and shortest distances he walked?
a)
1.5 miles
b)
2.5 miles
c)
3 miles
d)
5.5 miles
80.

What was the difference between the cars sold on Monday and Tuesday than the cars sold on Friday and Saturday
a)
1
b)
2
c)
3
d)
4
81.
Jorge made a dot plot of the distances he walked for the past 10 days. What is the difference between the longest and shortest distances he walked?
a)
1.5 miles
b)
2.5 miles
c)
3 miles
d)
5.5 miles
82.

How many kilograms of candy did Rachel get?
a)
4
b)
8
c)
32
d)
40
83.

Mrs. Collins made a scatterplot to show the relationship between the number of absences and a student’s final exam score. Based on this scatterplot, a student with 6 absences should get approximately what score on the final exam?
a)
65
b)
92
c)
70
d)
76
84.

Which day had more minutes of homework?
a)
Wednesday
b)
Thursday
c)
Friday
d)
Ms. Jones
85.

How many days did it snow MORE than 4/8 of an inch?
a)
10
b)
7
c)
8
d)
4
86.

Hudson got his friends to do the long jump and got these results.
2.3, 2.5, 2.5, 2.7, 2.8, 3.2, 3.6, 3.6, 4.5, 5.0
What is the amount of Hudson's friends that can jump 3.2 feet or more?
2.3, 2.5, 2.5, 2.7, 2.8, 3.2, 3.6, 3.6, 4.5, 5.0
What is the amount of Hudson's friends that can jump 3.2 feet or more?
a)
4
b)
2
c)
5
d)
8
87.

According to the scatter plot, Joe traveled 200 miles and Mary traveled 630 miles. What is the difference in the amount of money they spent?
a)
$1350
b)
$1750
c)
$1250
d)
$430
88.
Which of the following lists all parts of the five number summary?
a)
Mean, Median, Mode, Range, and Total
b)
Minimum, Quartile 1, Median, Quartile 3, and Maximum
c)
Smallest, Q1, Q2, Q3, and Q4
d)
Minimum, Maximum, Range, Mean, and Median
89.

What is the term for the median of the lower half of the data?
a)
Lower Quartile
b)
Upper Quartile
c)
Median
d)
Maximum
90.

What is the term for the median of the upper half of the data?
a)
Upper Quartile
b)
Lower Quartile
c)
Median
d)
Minimum
91.
What is the IQR of this data set?
9, 5, 6, 3, 1, 8
a)
3.5
b)
4
c)
5
d)
6.5
92.
Roger bowled 7 games last weekend. His scores are: 155, 165, 138, 172, 127, 193, 142. What is Roger's median score?
a)
127
b)
155
c)
156
d)
193
93.

What is the median of the data?
a)
200
b)
100
c)
90
d)
140
94.
You must find the 5 number summary in order to make a box and whisker plot.
a)
True
b)
False
95.

What is the IQR of the Cruisers?
a)
4
b)
6
96.
To find the average of a set of numbers, add up all the items and divide by...
a)
2
b)
The minimum
c)
The maximum
d)
The number of items
97.

What data value is the upper quartile (Q3)?
a)
64
b)
62
c)
66
d)
58
98.

What is the median?
a)
35
b)
30
c)
25
d)
50
99.

What is the maximum value?
a)
58
b)
66
c)
64
d)
60
100.

What is the minimum value?
a)
64
b)
58
c)
66
d)
60
101.
What is another word for average?
a)
Mean
b)
Median
c)
Mode
d)
Range
102.
what is the mathematical definition of outlier ?
a)
The average of the set of number
b)
The middle number
c)
A number that is way to high or way to low that belong in a group of numbers
103.
Find the range and the outlier of the given data:
126, 62, 144, 132, 144, 103
126, 62, 144, 132, 144, 103
a)
range: 82 out:62
b)
range: 62 out:62
c)
range:82 out:144
104.

50% of the Cruisers attended between 7 and 16 car shows. True or False?
a)
True
b)
False
105.

What is the difference in the IQRs?
a)
1
b)
2
c)
3
d)
4
106.

What is the IQR of the Car Hops?
a)
4
b)
6
107.

Which car club has the higher median?
a)
Cruisers
b)
Car Hops
108.

Which city has a minimum value that is lower?
a)
Millersburg
b)
Arcandia
109.
33, 25, 42, 25, 31, 37, 46, 29, 38
What is the third quartile of the data?
What is the third quartile of the data?
a)
37
b)
38
c)
40
d)
46
110.
33, 25, 42, 25, 31, 37, 46, 29, 38
What is the interquartile range of the data?
What is the interquartile range of the data?
a)
8
b)
9
c)
13
d)
21
111.
Identify the outlier for the given data?
23, 34, 27, 7, 30, 26, 28, 31, 34
23, 34, 27, 7, 30, 26, 28, 31, 34
a)
7
b)
23
c)
31
d)
34
100 %

