
Font size
 Worksheets
SBAC Analyzing Statistics Quiz
Total questions: 60
Worksheet time: 1hrs 25mins


At a middle school, the 7th graders will conduct a survey for where to go on a field trip. Which method will result in the least biased decision?
to randomly ask 8th grade students who went on a field trip last year
to randomly choose some 7th grade students to select a location
to ask all 7th grade teachers and administrators for a location
to ask the student council to choose a location
not enough information

Elliot says almost everyone arrived at the party after 10:00 P.M., but Nancy thinks most people came earlier. When did a majority of the people arrive?
7:00-7:59 P.M.
8:00–8:59 P.M.
9:00–9:59 P.M.
10:00–10:59 P.M.
7:00-10:59 P.M.

Which interval of students have the least number of pets?
15-19
0-4
5-9
10-14
not enough information

Given the histogram above select all the information that must be true
There are more students that are 55" than 56"
There are the same amount of students that are between 52"-55" and students that are taller than 55"
Student are more likely to be shorten than 52" than taller than 60"
The median of the data could be 56"
The range of the data is 19"

How many students have at least 7 Brothers and Sisters?
20 students
7 students
0 students
4 student
17 students

How many students received a score in the 90s?
4
3
91%
17
97%

What is the range of the data shown?
85
90
80
70
not enough information
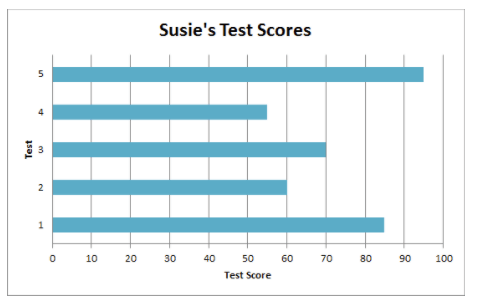
If Susie retakes her 4th quiz what is the maximum she can increase her test average for the class (mean).
55%
40%
45%
9%
5%
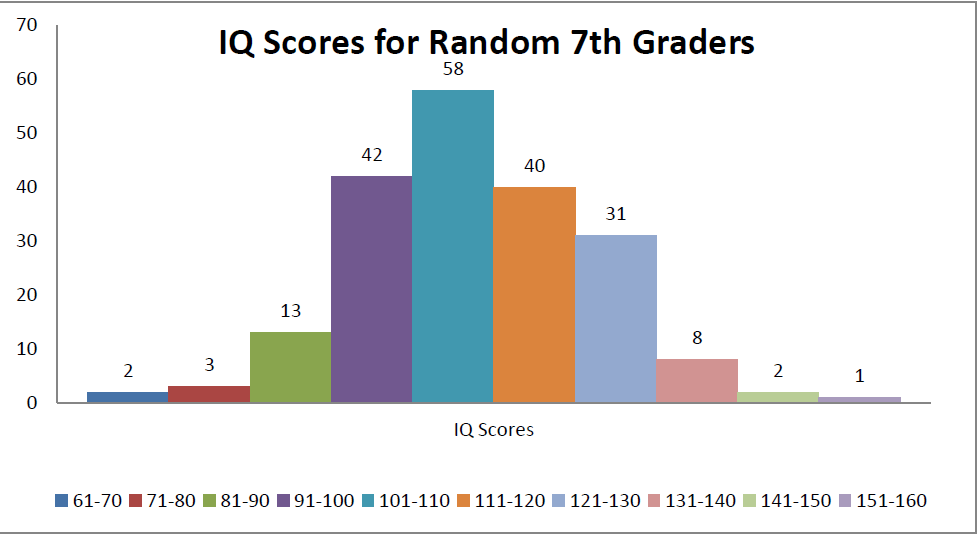
Calculate the relative frequency of having an IQ score in the 131-140 range. (200 7th graders were surveyed).
8%
4%
20%
15.5%
Not enough information
How many 7th graders had an IQ score in the 81-90 range?
13
6.5
3
42
not enough information
What was the most common IQ range?
91-100
111-120
12-130
101-110
not enough information

How many data points are greater than 34?
10
11
12
13
There are 2 values 34 value on the stem and leaf plot

Are these dot plots symmetric?
Both dot plots are symmetric
Neither dot plot is symmetric
The Gas mileage for SUV's dot plot is symmetric
The Gas mileage for Cars dot plot is symmetric
Not enough information

What is the MODE of this data?
90
85, 90, and 95
85 and 95
There is not a mode for the data set
All the numbers are a mode for the data set
The choir director in a high school wants to know how the students in the school feel about singing. If the director selects 100 girls and 100 boys to complete a survey, which method will result in a biased sample?
The students will be selected from the choir
The students will be selected randomly throughout the school
The students will be selected on Wednesday afternoon who are attending the choir concert.
The choir director will select five students from each of the forty homerooms in the school
The choir director surveys all the students in the school that he knows.
Which scenario would produce the least biased results?
asking athletes at a gym what their favorite television show is
asking shoppers at a store where their favorite place to shop is
asking fans at a baseball game who their favorite baseball team is
asking students in a college library what their favorite college sports team is
asking football players if high school athletics is important to the high school experiance
Ana wants to know the average student’s opinion of the tardy policy at her school. Which group of students should she survey in order to achieve the most accurate results?
thirty students who are often tardy
thirty students who are rarely tardy
thirty of her friends
thirty randomly selected students from her school
It does not matter who she surveys students are either tardy or not
Marcos wants to find out how many students at his school like to go to the movies. Which survey method is likely to produce a representative survey?
Ask the boys in the boys locker room.
Ask the 25 students in his homeroom class.
Ask students coming out of a movie theater.
Ask half of the 34 students on the soccer team.
Marcos surveys all his friends
A factory manufactures light bulbs. The factory currently has 300 boxes of light bulbs in its warehouse. To test the quality of bulbs, Alex decides to take out a sample of bulbs and test them to see if they work. Which surveying method will give him the least valid results?
selecting ten boxes randomly, mixing the bulbs of these boxes together and then selecting ten bulbs randomly
selecting ten boxes randomly and then selecting one bulb randomly from each box
selecting one bulb randomly from every tenth box
selecting one box randomly and then selecting all the bulbs from the box
not enough information
Which of the following questions are statistical questions that have variability? Select all that apply.
What is your favorite fruit?
How many servings of fruit did you eat yesterday?
How many servings of fruit did each person in your family eat yesterday?
How many people in your family like bananas?
How many bananas are in each bunch that is for sale at the store?

The scatter plot shows the relationship between the number of chapters and the total number of pages for several books. Use the trend line to predict how many chapters would be in a book with 180 pages.
12 chapters
15 chapters
18 chapters
21 chapters
not enough information

Describe the correlation in the graph shown.
Strong Negative
Strong Positive
Weak Negative
Weak Positive
No Correlation

About how many male math teachers would you expect to have in 2014?
40
30
35
45
50


Based on the graph, if Joe earned $400, how many hours did he work?
25 hours
35 hours
45 hours
15 hours
50 hours


What percentage of SUV's are driven by women?
56.25%
75%
83.25%
86.5%
Not enough information

What percentage of girls have blonde hair?
30%
32%
29%
40%
not enough information

According to the table, what is the relative frequency of Students ages 14 - 17 who skip breakfast?
About 27%
About 35%
About 15%
About 30%
not enough information

The following scatter plot shows Pam's training as she prepares to run a 6 mile race at the end of the month. Which of the following would be a reasonable approximation for the length of time it would take for her to run 6 miles?
50 min
80 min
45 min
60 min
Not enough information

What type of association does this graph show?
strong positive
strong negative
weak positive
weak negative
No correlation

Select the statement that best describes the line.
The line is the line of best fit.
The line is NOT a line of best fit because it does not go through the origin.
The line is NOT a line of best fit because it does not go through the middle of the data set.
This is the line that restricts any minimum value in the future
This is the line that restricts any maximum value in the future

Based on the frequency table which of the following must be true
Student who studied longer did better on their test
All students study between 1/2 hour and an hour
The student that studied 70 minutes is the student with the highest grade in the class
It is less likely a student will study exactly 50 minutes than it is to study more than 50 minutes.
Students prefer to study 50 minutes more than any other amount of time.

Choose the best option.
To make this graph 22 studentes were interviewed.
The mean of the data is 5.
More than 50% preferred soccer.
The range of the data is 7.
Football is more popular than Softball

Skewed Right
Skewed Left
Uniform
Symmetric
Not enough information

What type of distribution is this?
Skewed Right
Skewed Left
Uniform
Symmetric
Not enough information

Skewed Right
Skewed Left
Uniform
Symmetric
Not enough information
How many students have an IQ of 111?
40
8
6
4
Not enough information

The team scored 80 points. How many points did Porter score?
40 points
32 points
16 points
14.4 points
12 point

There are 200 vegetable plants in a garden. How many of the vegetable plants are green beans?
12
16
24
28
48

How many more students played soccer than hockey?
4
30
6
60
40

Approximately, how much time does a student spend socializing during a calendar week?
3 hours
13 hours
21 hours
26 hours
not enough information
A shipment of 200 apples came into HEB on Tuesday. 10 of the apples had gone bad. What percent of the apples were still good?
95%
75%
50%
10%
5%
Angie wants to tip her taxicab driver 20%. If her commute costs $15, what is the total cost?
$30
$18
$3.00
$1.80
Not enough information

How many pizzas were sold by Domiano’s Pizza and Little Secrets Pizza?
200
180
160
100
9

How many more students liked pizza than
those that liked chicken and taco's?
15
10
9
6
5

Look at the graph.
Which is correct?
Sales of food and drink... from Monday to Friday.
remain constant
increases
decreases
fluctuates
not enough information

Look at the graph.
Which of the following is true? Choose all that apply
From Tuesday to Wednesday drink consumption decreases more than the decrease in food consumption
More drinks are consumed on Tuesday than any other day
Drink consumption increases from Wednesday to Friday.
Food consumption increases from Wednesday to Friday.
People consume at least as much food on Tuesday as they do on any other day
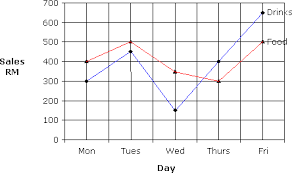
People consume more drinks on the weekend then they do on any of the weekdays.
Monday
Tuesday
Thursday
Friday
Not enough information

What is the main purpose of a line graph?
to compare two things
to show trends over time
to have an independent variable
so you don't have to read words
to show their is a negative correlation between the two quantities in the graph.

This double line graph for rainfall in two cities shows what pattern?
Rain is steady all year.
It is rainier in the summer months than in winter.
It is the rainiest in winter.
There is no rain. Both cities are dry year round.
City 1 gets more rainfall than city 2

What is the difference between the shortest and the longest distance of the baseball thrown?
1,005 feet
85 feet
82 feet
80 feet
not enough information

Which three ages combined have the highest number of students
6.7.8
8,9,10
10,11,12
4,5,6
Numbers greater than 7

Between which two days was the greatest decrease in rate of change in push-ups?
Friday and Saturday
Tuesday and Wednesday
Sunday and Monday
Thursday and Friday
Not enough information

What data value is the upper quartile?
64
62
66
58
60

What is the interquartile range (IQR)?
4
64
60
8
Not enough information
33, 25, 42, 25, 31, 37, 46, 29, 38
What is the third quartile (UQ) of the data?
37
38
40
46
not enough information

