
 Worksheets
8th Grade Second Semester Final Exam Review
Total questions: 70
Worksheet time: 2hrs 56mins
Name
Class
Date
1.
6z + 3 -4z = 9
a)
z = 3
b)
z = 60
c)
z = 30
d)
z = 1
2.
Solve for f:
f - 4 = 6f + 26
f - 4 = 6f + 26
a)
f = -5
b)
f = 5
c)
f = 6
d)
f = -6
3.
Solve for x:
5x - 14 = 8x + 4
5x - 14 = 8x + 4
a)
x = 6
b)
x = -6
c)
x = -18/13
d)
x = 10/3
4.
Solve for x:
4(1-x)+3x=-2(x+1)
4(1-x)+3x=-2(x+1)
a)
x = -6
b)
x = 6
c)
x = 3
5.
Solve:
2(4x-3) - 8 = 4 + 2x
2(4x-3) - 8 = 4 + 2x
a)
x = 5/3
b)
x = 3
c)
x = 1
d)
x = 2
6.
Solve the inequality.
x + 5 ≤ 13
x + 5 ≤ 13
a)
x ≥ 8
b)
x ≥ 18
c)
x ≤ 8
d)
x ≤ 18
7.
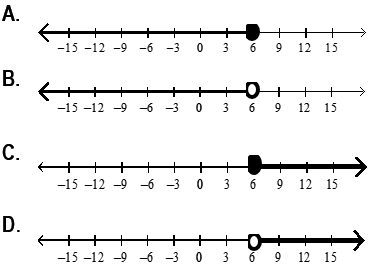
Pick the correct letter for:
6 > x
6 > x
a)
A
b)
B
c)
C
d)
D
8.

Pick the correct inequality.
a)
A
b)
B
c)
C
d)
D
9.
7 is less than a number.
a)
x > 7
b)
x < 7
c)
x ≤ 7
d)
x ≥ 7
10.
Which sentence represents m > 41?
a)
Mary’s points, m, totaled more than 41
b)
Calvin ran no less than 41 miles, m
c)
The temperature, m, was less than 41°F
d)
The magazines’ cost, m, was not more than $41.
11.
-4x + 14 ≤ 54
a)
x ≥ - 10
b)
x ≤ -10
c)
x ≥ 10
d)
x ≤ 10
12.
-2 (x+2) < 14
a)
x < - 5
b)
x > -5
c)
x < -9
d)
x > -9
13.
6(n + 2) < -72
a)
n < -14
b)
n < 35/3
c)
n < -10
d)
∞
14.
Which inequality is used with the key word "at most"
a)
Greater than
b)
Less Than
c)
Less than or equal to
d)
Greater than or equal to
15.
Joaquin has a $50 gift card from Pizza Palace. All pizzas at Pizza Palace cost $7 each. Joaquin wants to give the driver a $5 tip for delivering the pizza. Which inequality could be used to determine the possible number of pizzas, p, he could order with his gift card, including the tip?
a)
7p + 5 ≤ 50
b)
(7 + 5)p ≤50
c)
7p + 5 ≥ 50
d)
7p + 5 < 50
16.
a - 6 ≤ 15 + 8a
a)
a ≤ - 3
b)
a ≥ -3
c)
a ≥ 3
d)
a ≤ -3
17.
-8x + 2x -16 < -5x + 7x
a)
x < 2
b)
x < -2
c)
x > 2
d)
x > -2
18.
-x < -x + 7(x - 2)
a)
x > -2
b)
x < -2
c)
x > 2
d)
x < 2
19.
-1 - 6x - 6 > -11 - 7x
a)
x > -4
b)
x < -4
c)
x > 4
d)
x < 4
20.
Solve:
3(x - 2) < 2(x + 9)
3(x - 2) < 2(x + 9)
a)
x<24
b)
x>12
c)
x<12
d)
x>24
21.
Solve:
4(2a + 3) < 3(a - 1)
4(2a + 3) < 3(a - 1)
a)
a<-3
b)
a>-3
c)
a<3
d)
a>3
22.
-4x-2y=-12
4x+8y=-24
4x+8y=-24
a)
(5,6)
b)
(6,-6)
c)
(6,-2)
d)
(4,-3)
23.
x-y=11
2x+y=19
2x+y=19
a)
(10,-1)
b)
(-1,10)
c)
(3,-4)
d)
(6,7)
24.
-6x+5y=1
6x+4y=-10
6x+4y=-10
a)
(1,-1)
b)
(0,-1)
c)
(1,1)
d)
(-1,-1)
25.
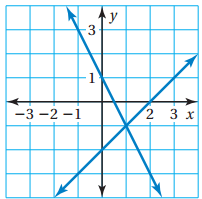
What is the solution?
a)
1
b)
-2
c)
(1, 2)
d)
(1, -1)
26.
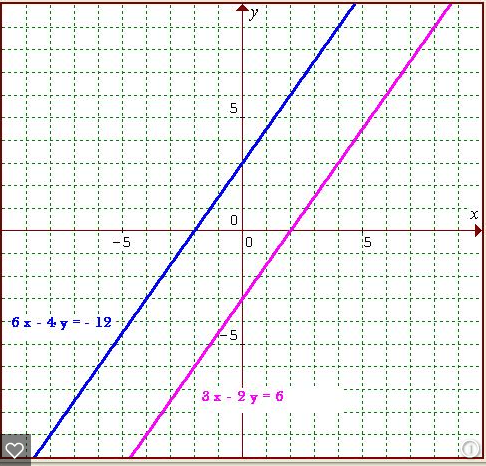
This system has _____ solutions
a)
no
b)
1
c)
2
d)
Infinitely many
27.
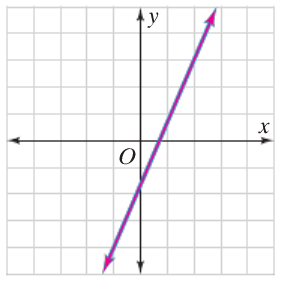
What is the solution?
(Hint: Both lines are graphed over each other)
(Hint: Both lines are graphed over each other)
a)
One Solution
b)
No solution
c)
Infinitely Many Solutions
28.
Solve:
y = 7x + 9
2y + 2x = -18
y = 7x + 9
2y + 2x = -18
a)
(5, 0)
b)
(9, 18)
c)
(-2, -5)
d)
(1, 16)
29.
What is the solution to this system?
x - y = 6
y= 2x - 5
x - y = 6
y= 2x - 5
a)
(1,3)
b)
(-1,3)
c)
(-1,-7)
d)
(1,-7)
30.
Solve by elimination
-2x+6y= 16
-4x-3y= 2
-2x+6y= 16
-4x-3y= 2
a)
(2,2)
b)
(-2, -2)
c)
(-2,2)
d)
(2,1)
31.
Solve for x and y
3x + 2y = 16
7x + y = 19
3x + 2y = 16
7x + y = 19
a)
(-2,5)
b)
(-2,-5)
c)
(2,-5)
d)
(2,5)
32.
What is the solution?
a)
1
b)
-2
c)
(1, 2)
d)
(1, -1)
33.
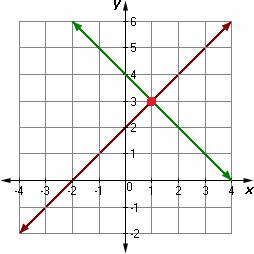
What is the solution to the system?
a)
(0, 3)
b)
(1, -1)
c)
(-3, 1)
d)
(1, 3)
34.

What is the solution?
a)
(6, 3)
b)
(3, 6)
c)
(-6, 3)
d)
No solution
35.
If a system of equations has no solution, what does the graph look like?
a)
intersecting lines
b)
parallel lines
c)
skew lines
d)
intersecting lines
36.

Match the system to the graph (solution set is on the left)
a)
y ≤ 3x and y ≤ -2x + 4
b)
y > 3x and y > -2x + 4
c)
y < 3x and y > -2x + 3
d)
y > 3x and y < -2x + 4
37.

Which of the following is not a solution to this system of inequalities?
a)
(0,-1)
b)
(0,3)
c)
(4,0)
d)
(6,-2)
38.

Which point below is NOT part of the solution set?
a)
(0, 0)
b)
(5, 1)
c)
(-1, -3)
d)
(20, -5)
39.

Which system of inequalities is shown?
a)
y ≥ -x - 1
y < x + 4
y < x + 4
b)
y < -x - 1
y ≥ x + 4
y ≥ x + 4
c)
y > -x - 1
y ≥ x + 4
y ≥ x + 4
d)
y > -x - 1
y ≥ x + 3
y ≥ x + 3
40.

Select the correct graph for each inequality.
a)
A
b)
B
c)
C
d)
D
41.

Select the correct graph for each inequality.
a)
A
b)
B
c)
C
d)
D
42.

Select the correct graph for each inequality.
a)
A
b)
B
c)
C
d)
D
43.
How can I tell if an inequality will have a solid line?
a)
It has an equal sign.
b)
The symbol is greater than.
c)
The symbol has "or equal to."
d)
You just guess.
44.

Which point below is NOT part of the solution set?
a)
(0, 0)
b)
(5, 1)
c)
(-1, -3)
d)
(20, -5)
45.
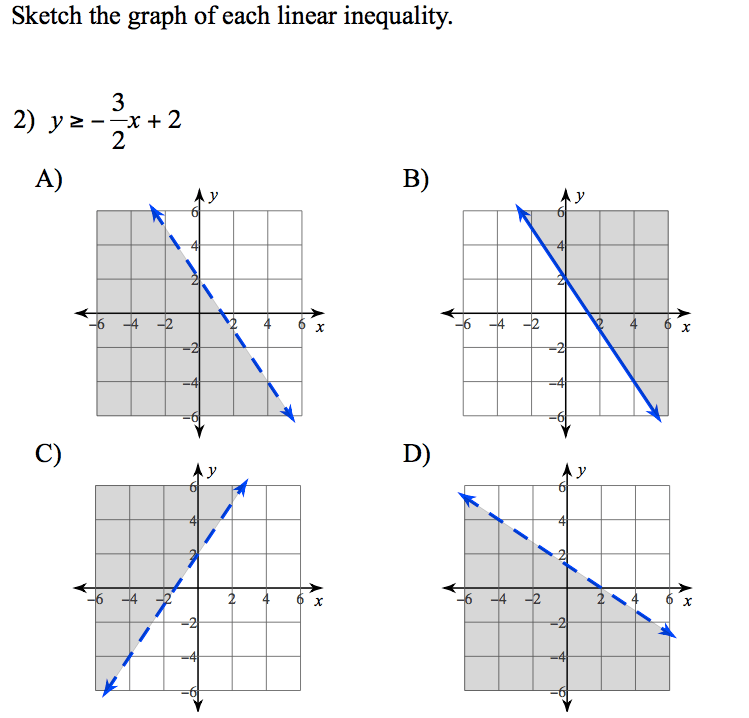
Select the correct graph for each inequality.
a)
A
b)
B
c)
C
d)
D
46.

Select the correct graph for each inequality.
a)
A
b)
B
c)
C
d)
D
47.

What is the relative frequency (to the nearest percent) of boys among those who cannot bike to school?
a)
4%
b)
14%
c)
13%
d)
29%
48.

What percentage of SUV's are driven by women?
a)
56.25%
b)
75%
c)
83.25%
d)
86.5%
49.

A survey explored the relationship between gender and band class. Which is a reasonable conclusion?
a)
There are more band members than non-band members
b)
There are more boys in the class than girls
c)
There are more boys in band than not in band
d)
More than half of the bands members in the class are girls
50.

According to the two-way table, a person who plays an instrument is most likely to:
a)
Not play an instrument
b)
Not play a team sport
c)
Play a team sport
d)
All of the above
51.

Of the times when the forecast called for rain, what is the percentage that it actually rained?
a)
About 90%
b)
About 50%
c)
About 70%
d)
About 80%
52.

What percentage of males drive sports cars?
a)
35%
b)
16.25%
c)
65%
d)
25%
53.

The scatter plot shows the relationship between the number of chapters and the total number of pages for several books. Use the trend line to predict how many chapters would be in a book with 180 pages.
a)
12 chapters
b)
15 chapters
c)
18 chapters
d)
21 chapters
54.

The following scatter plot shows Pam's training as she prepares to run a 6 mile race at the end of the month. Which of the following would be a reasonable approximation for the length of time it would take for her to run 6 miles?
a)
A. 50 min
b)
B. 80 min
c)
C. 45 min
d)
D. 60 min
55.
The number of siblings you have and your weight.
a)
Positive correlation
b)
Negative correlation
c)
No correlation
d)
All of the above
56.
If a scatterplot has no correlation then...
a)
...it has no ordered pairs
b)
...it has ordered pairs that have a negative pattern
c)
...its ordered pairs have no predictable pattern
d)
..it has ordered pairs that have a positive pattern
57.
If a scatterplot has no correlation then...
a)
...it has no ordered pairs
b)
...it has ordered pairs that have a negative pattern
c)
...its ordered pairs have no predictable pattern
d)
..it has ordered pairs that have a positive pattern
58.

Which graph shows the line of best fit?
a)
A
b)
B
c)
C
d)
D
59.

Select the statement that best describes the line.
a)
The line is the line of best fit.
b)
The line is NOT a line of best fit because it does not go through the origin.
c)
The line is NOT a line of best fit because it does not go through the middle of the data set.
60.
What type of correlation (association)?
The outside temperature and the amount of layers you wear.
The outside temperature and the amount of layers you wear.
a)
Positive correlation
b)
Negative correlation
c)
No correlation
d)
All of the above
61.

Find the slope from the table:
a)
-2/5
b)
5/-2
c)
5/2
d)
2/5
62.

Find the slope from the table.
a)
-4
b)
1
c)
4
d)
-2
63.
Find the slope of the line that passes through
(10, 1) and (5, 2)
(10, 1) and (5, 2)
a)
1/5
b)
-1/5
c)
5
d)
-5
64.
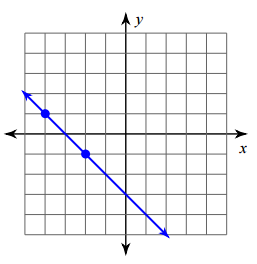
Find the slope of the line.
a)
-2
b)
2
c)
-1
d)
1
65.
Find the slope of the line that passes through the points (2, 4) and (6, 12)
a)
1/2
b)
-1/2
c)
2
d)
-2
66.

Write the equation for the line.
a)
y = 46x
b)
y = -1/2x
67.

What is the equation of the line of best fit?
a)
y = -25x + 170
b)
y = -5/8x + 170
c)
y = 25x + 170
d)
y = 5/8x + 170
68.

Use the line of best fit to approximate rate of change relative to the scatter plot above.
a)
7/5
b)
5/7
c)
-7/5
d)
-5/7
69.

What is the correlation between the x and y variables?
a)
y increases as x increases
b)
y is constant
c)
y decreases as x decreases
d)
y descreases as x increases
70.

What is the equation of the line of best fit?
a)
y = 3/2x
b)
y = 30x
c)
y = 30x + 300
d)
y = 3/2x + 300
100 %

