
NEW
Font size
S
M
L
XL
 Worksheets
Proportional Relationships
Total questions: 70
Worksheet time: 3hrs 36mins
Name
Class
Date
1.
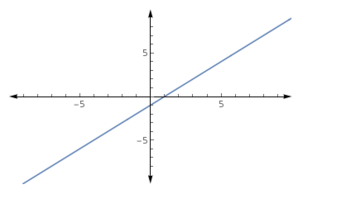
Does this graph represent a proportional relationship?
a)
No, because it doesn't pass through the origin.
b)
Yes, because it doesn't pass through the origin.
c)
Yes, because it intersects the y axis.
d)
No, because it intersects the x axis.
2.
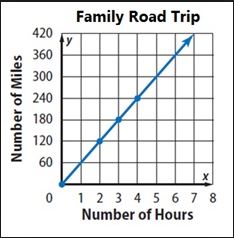
What is the unit rate in this proportional relationship?
a)
60 miles/1 hour
b)
120 miles/ 2 hours
c)
1 mile/ 1 hour
3.

Write an equation for this relationship.
a)
y=1/5x
b)
y=1/2x
c)
y=2x
d)
y=5x
4.

Is the graph proportional or non-proportional?
a)
Proportional
b)
Non-Proportional
5.

REVIEW QUESTION
Which best describes the graph represented in this table?
Which best describes the graph represented in this table?
a)
proportional
b)
non-proportional
6.

Is the graph proportional or non proportional?
a)
proportional
b)
non proportional
7.
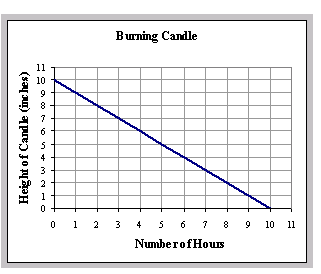
Is the graph proportional or non proportional?
a)
proportional
b)
non proportional
8.

Why does this graph show a non-proportional relationship?
a)
Because it is proportional
b)
It goes through the origin
c)
It does not go through the origin
d)
It is a straight line
9.

Is the graph proportional or non proportional?
a)
proportional
b)
non proportional
10.

Is the graph proportional or non proportional?
a)
proportional
b)
non proportional
11.

Which graph is proportional?
a)
A
b)
B
c)
C and D
d)
All of the graphs are proportional
12.

Does this graph represent a proportional relationship?
a)
Yes, because the line is pretty.
b)
No, because the line goes through the origin.
c)
Yes because the line goes through the origin.
d)
No, because the graph is non-proportional.
13.

Which graph is non-proportional?
a)
A
b)
B
c)
C
d)
D
14.

REVIEW QUESTION
Is this table proportional or non-proportional?
Is this table proportional or non-proportional?
a)
Proportional
b)
Non-Proportional
15.

Is the graph proportional or non proportional?
a)
proportional
b)
non proportional
16.

Is the graph proportional or non proportional?
a)
proportional
b)
non proportional
17.

A line is linear if it forms a straight line. A line that does not form a straight line is non-linear. Which best describes this graph?
a)
linear and non-proportional
b)
non-linear and non-proportional
c)
linear and proportional
d)
non-linear and proportional
18.

The graph shows the water level as a bathtub fills. Select the correct choice that describes this graph.
a)
The graph is proportional.
b)
The graph is proportional and non-proportional.
c)
The graph is a unit rate and a percentage
d)
The graph is non-proportional.
19.

Is the graph proportional or non-proportional?
a)
Proportional
b)
Non-Proportional
20.

What is the constant of proportionality?
a)
8
b)
16
c)
24
d)
2
21.
Craig earns extra money as a lifeguard. He earns $37 for 4 hours and $64.75 for 7 hours. What is the constant of proportionality?
a)
$37
b)
$64.75
c)
$9.25
d)
$18.50
22.

Write an equation for this situation.
a)
y=9.75x
b)
y=19x
c)
y=19.25x
d)
y=9.5x
23.

Write an equation for this relationship.
a)
y=10.99x
b)
y=22.98x
c)
y=22x
d)
y=21.98x
24.

Which statement best describes the relationship of x and y in the table?
a)
Proportional
b)
Not Proportional
25.

Which statement best describes the relationship between x and y in the table?
a)
Proportional
b)
Not Proportional
26.
What are the main characteristics of a proportional relationship between two variables?
a)
They pass through the origin.
b)
They are linear and also pass through the origin.
c)
They are curved
d)
They have a negative relationship and pass through the origin.
27.
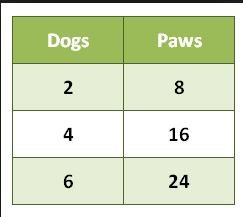
Which statement best describes the relationship between x and y in the table?
a)
Proportional
b)
Not Proportional
28.

Which graph is non-proportional?
a)
A
b)
B
c)
C
d)
D
29.

What is the constant of proportionality (in miles per hour) based on the table?
a)
45
b)
90
c)
135
d)
2
30.
Is this table proportional?
a)
Yes
b)
No
31.

Is this graph proportional?
a)
Yes
b)
No
32.
Find the unit rate: $3.60 for 3 pounds of apples. How much does it cost for 1 pound of apples?
a)
$1.00 per pound
b)
$3.60 per pound
c)
$1.20 per pound
d)
$1.10 per pound
33.

Do the ratios form a proportion?
a)
Yes, they form a proportion.
b)
No, they do not form a proportion.
34.
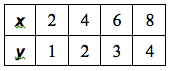
Does the table represent a proportional relationship?
a)
Yes.
b)
No.
35.

Does the table represent a proportional relationship?
a)
Yes.
b)
No.
36.
What makes a graph proportional?
a)
Linear
b)
The line goes through the origin
c)
Curvy line
d)
Linear and the line goes through the origin
37.

Is the graph proportional or non proportional?
a)
proportional
b)
non proportional
38.

Is this table proportional?
a)
Yes
b)
No
39.

Why does this graph show a non-proportional relationship?
a)
Because it is proportional
b)
It goes through the origin
c)
It does not go through the origin
d)
It is a straight line
40.

Is this table proportional?
a)
Yes
b)
No
41.

Which graph is proportional?
a)
A
b)
B
c)
C and D
d)
All of the graphs are proportional
42.

Which graph is non-proportional?
a)
A
b)
B
c)
C
d)
D
43.

Does this graph represent a proportional relationship?
a)
Yes
b)
No
44.

Does this graph represent a proportional relationship?
a)
Yes
b)
No
45.

What is the unit rate for this graph?
a)
100
b)
25
c)
50
d)
200
46.

Which color car represents a proportional relationship?
a)
Red car
b)
White car
c)
Both cars
d)
None of the cars
47.

Does this table represent a proportional relationship?
a)
Yes
b)
No
48.

What is the constant of proportionality for this table?
a)
1/9
b)
9
c)
8
49.

Which statement matches the graph?
a)
Taylor can write 6 words per minute
b)
Taylor can write 25 words per minute
c)
Taylor can write 50 words per minute
d)
Taylor can write 150 words per minute
50.

Which line shows a proportional relationship between x and y?
a)
Line L
b)
Line M
51.

What is the unit rate in this proportional relationship?
a)
60 miles/1 hour
b)
120 miles/ 2 hours
c)
1 mile/ 1 hour
52.

Which statement best describes the relationship between x and y in the table?
a)
Proportional
b)
Not Proportional
53.

Which graph is non-proportional?
a)
A
b)
B
c)
C
d)
D
54.
The cost of 4 pounds of grapes is $24.36. What is the constant of proportionality the relates cost in dollars, y, to the number of pounds of grapes, x?
a)
6.09
b)
20.36
c)
8.12
d)
28.36
55.

Does this graph represent a proportional relationship?
a)
No, because it doesn't pass through the origin.
b)
Yes, because it doesn't pass through the origin.
c)
Yes, because it intersects the y axis.
d)
No, because it intersects the x axis.
56.
What is the unit rate in this proportional relationship?
a)
60 miles/1 hour
b)
120 miles/ 2 hours
c)
1 mile/ 1 hour
57.
Which statement best describes the relationship between x and y in the table?
a)
Proportional
b)
Not Proportional
58.
Which graph is non-proportional?
a)
A
b)
B
c)
C
d)
D
59.
What is the constant of proportionality (in miles per hour) based on the table?
a)
45
b)
90
c)
135
d)
2
60.
Is this table proportional?
a)
Yes
b)
No
61.
Is this graph proportional?
a)
Yes
b)
No
62.
Find the unit rate: $3.60 for 3 pounds of apples. How much does it cost for 1 pound of apples?
a)
$1.00 per pound
b)
$3.60 per pound
c)
$1.20 per pound
d)
$1.10 per pound
63.
Does the table represent a proportional relationship?
a)
Yes.
b)
No.
64.
Do the ratios form a proportion?
a)
Yes, they form a proportion.
b)
No, they do not form a proportion.
65.
What makes a graph proportional?
a)
Linear
b)
The line goes through the origin
c)
Curvy line
d)
Linear and the line goes through the origin
66.
Is the graph proportional or non proportional?
a)
proportional
b)
non proportional
67.
Is this table proportional?
a)
Yes
b)
No
68.
Why does this graph show a non-proportional relationship?
a)
Because it is proportional
b)
It goes through the origin
c)
It does not go through the origin
d)
It is a straight line
69.
Is this table proportional?
a)
Yes
b)
No
70.
Which graph is proportional?
a)
A
b)
B
c)
C and D
d)
All of the graphs are proportional
Reset

