
 Worksheets
01b - PvT and VvT Graphs
Total questions: 25
Worksheet time: 22mins
Name
Class
Date
1.
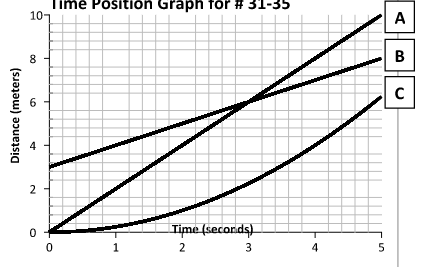
Which runner had a head start?
a)
A
b)
B
c)
C
2.

What is this graph showing?
a)
Constant Speed
b)
Acceleration (speeding up)
c)
Deceleration (slowing down)
d)
No motion
3.

from 3rd second to 5th second, the object is
a)
moving at a constant speed
b)
speeding up
c)
not moving
d)
slowing down
4.

Which runner won the race?
a)
A
b)
B
c)
C
5.

What does this graph represent?
a)
Constant speed
b)
Acceleration
c)
Not moving
6.

What is happening at D?
a)
Stationary
b)
Accelerating
c)
Fast steady speed; moving away from the starting position
d)
Slower steady speed; moving away from the starting position
7.
Velocity is
a)
speed
b)
direction
c)
speed with a direction
8.
A runner races in the 100 meter dash. It takes her 10 seconds to finish. What is her average speed?
a)
10 m/s
b)
1000 m/s
c)
100 seconds
d)
10 seconds
9.

What kind of acceleration is shown here?
a)
positive
b)
negative
c)
none
d)
varies
10.

What kind of acceleration is shown here?
a)
positive
b)
negative
c)
none
d)
varies
11.

What is the velocity?
a)
not moving
b)
increasing
c)
positive
d)
negative
12.

What is the velocity?
a)
positive
b)
negative
c)
decreasing
d)
increasing
13.

What is the velocity?
a)
0 m/s
b)
positive m/s
c)
negative m/s
d)
decreasing
14.

Is the speed constant or non-constant?
a)
constant
b)
non-constant
15.

Is the speed constant or non-constant?
a)
constant
b)
non-constant
16.
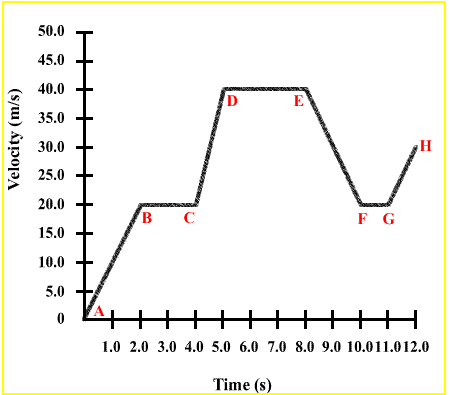
Which section of the graph shows constant velocity?
a)
AB
b)
BC
c)
EF
d)
GH
17.

Which section of the graph shows increasing velocity?
a)
AB
b)
BC
c)
DE
d)
EF
18.
Speed is a _________ quantity
a)
scalar
b)
vector
19.
Velocity is a ____________ quantity.
a)
scalar
b)
vector
20.
Any vector quantity has ____________
a)
magnitude
b)
direction
c)
both magnitude and direction
21.

The graph shows Ashley riding her bike to Maria's house.
What is occurring from point A to point B?
What is occurring from point A to point B?
a)
they are traveling at a constant speed
b)
they are decreasing in speed
c)
they stopped to take a break
22.

The graph shows Ashley riding her bike to Maria's house.
What was occurring from point B to point C?
What was occurring from point B to point C?
a)
She was increasing her speed.
b)
She stopped for 4 minutes
c)
She was decreasing in speed
23.

A student draws a straight blue line on a position-time graph to represent the general shape of the position-time data for a toy.
What is this straight blue line called?
What is this straight blue line called?
a)
Distance line
b)
Slope line
c)
Uniform line
d)
Line of best fit
24.

What is this object doing?
a)
speeding up
b)
slowing down
c)
not moving
d)
moving at a constant velocity
25.
On a position-time graph, the position (distance) is plotted on the ____ axis.
a)
x
b)
y
100 %

