Wayground logo

Free Printable Worksheets

Font size

S
M
L
XL
Worksheets

Line of Best Fit

Total questions: 20

Worksheet time: 33mins

Name
Class
Date
1.
What is a line of best fit used for?
a)
To make predictions
b)
To make the graph look pretty
c)
To connect the points
d)
To make it look like you know what you are doing
2.
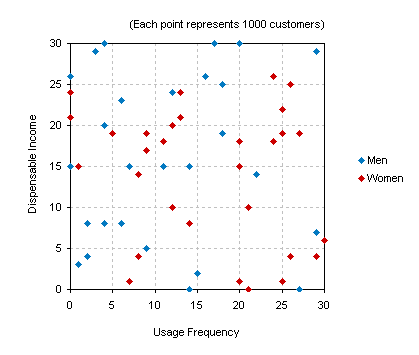
What type of association does this graph have?
a)
positive 
b)
negative
c)
none
d)
all of the above
3.
About how many male math teachers were there in 2006?
a)
15
b)
30
c)
35
d)
45
4.
What type of association does this graph show?
a)
Positive
b)
negative
c)
none
d)
all of the above
5.
Which sentence describes the relationship shown on this scatter plot?
a)
As the temperature decreases, the visitors increase. 
b)
As the temperature increases, the number of visitors increases. 
c)
As the visitors increase, the temperature decreases. 
d)
No correlation
6.
What would be the correlation between study time and test grades?
a)
positive
b)
negative
c)
none
d)
cannot be determined
7.

Determine the predicted income if 22 hours were worked on an assembly job.

a)

$207.30

b)

$449.60

c)

$691.90

d)

$543.30

8.
What type of correlation do you think there is between:
Time Spent Watching TV & Grades
a)
Positive correlation
b)
Negative correlation
c)
No correlation
d)
cannot be determined
9.
What would be the correlation be between study time and test grades?
a)
positive correlation
b)
negative correlation
c)
no correlation
d)
cannot be determined
10.

This measures how strong or weak the relationship between 2 quantitative variables are.

a)

Scatter Plot

b)

Causation

c)

Correlation

d)

Line of best fit

11.

What does the value, r= -0.89, tell us about the linear relationship of two quantitative variables?

a)

Strong positive

b)

Weak positive

c)

Strong negative

d)

Weak negative

12.
When you check your scatter plot to see if it is straight (linear), curved, or any other pattern you are looking at _________
a)
Form
b)
Direction
c)
Outlier
d)
Strength
13.

Determine the correlation coefficient of the given data:

a)

.9820

b)

-.9643

c)

1.409

d)

.6864

14.

Is this line an accurate line estimate of best fit for the data?

a)

Yes

b)

No

15.

Is this line an accurate line estimate of best fit for the data?

a)

Yes

b)

No

16.

Shape?

a)

Skewed right

b)

Skewed left

c)

Symmetric

d)

Normal

17.

What type of Correlation?

a)

Positive Correlation

b)

Negative Correlation

c)

No Correlation

18.

What type of Correlation?

a)

Positive Correlation

b)

Negative Correlation

c)

No Correlation

19.
Which graph has a correlation coefficient (r) of about -.6 ?
a)
a
b)
b
c)
c
d)
d
20.

What is the y-intercept?

a)

-2

b)

3

c)

2

d)

-3