
NEW
Font size
 Worksheets
Describing Line Graphs
Total questions: 12
Worksheet time: 10mins
Which is the correct ending?
The number of gorillas ....
...decreased sharply.
..decreased sharp.
.. a sharp decrease.
.. sharply decrease.

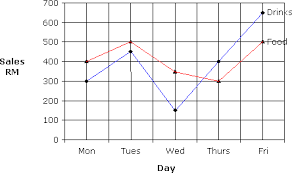
Look at the graph.
Which is correct?
Sales of food and drink... from Monday to Friday.
remained stable
rose
dropped
fluctuated

From Tuesday to Wednesday there is ....

During which month did the restaurant sell 40 pizzas?
March
May
July
August

Between which 2 weeks did the plant grow the MOST?
Week 1 and Week 2
Week 2 and Week 3
Week 3 and Week 4
Week 4 and Week 5

What does this show?
decrease / fall
increase / rise
steady / stable / constant
Fluctuates

What does this show?
Steady fall / decrease
Steady increase
Increase / rise/
Steady / constant / stable

What does this show?
a fluctuation
a decrease
an increase
remained steady
The number of pizzas sold rose to a peak in July before ______ to a low in November.
lowing
fell
dropping
fall

