wayground logo

Free Printable Worksheets

NEW

Font size

S
M
L
XL
Worksheets

Graphing

Total questions: 50

Worksheet time: 35mins
Name
Class
Date
1.

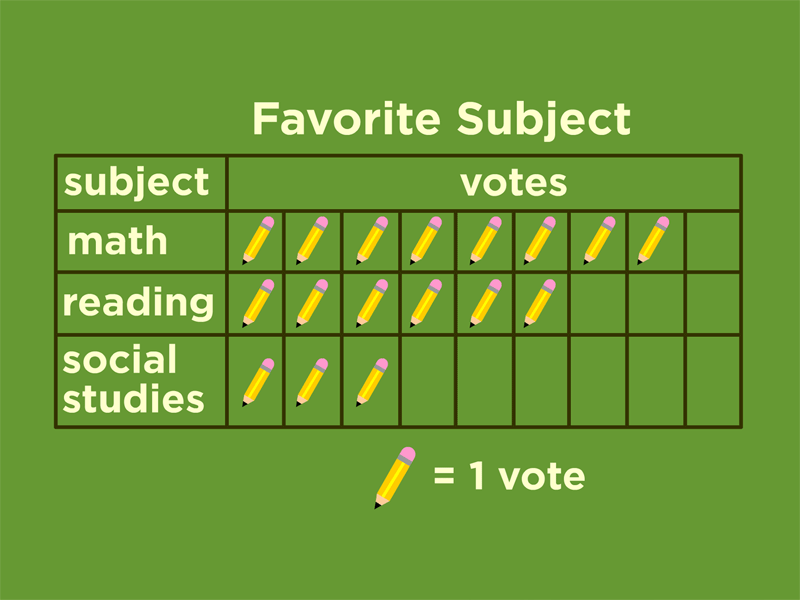
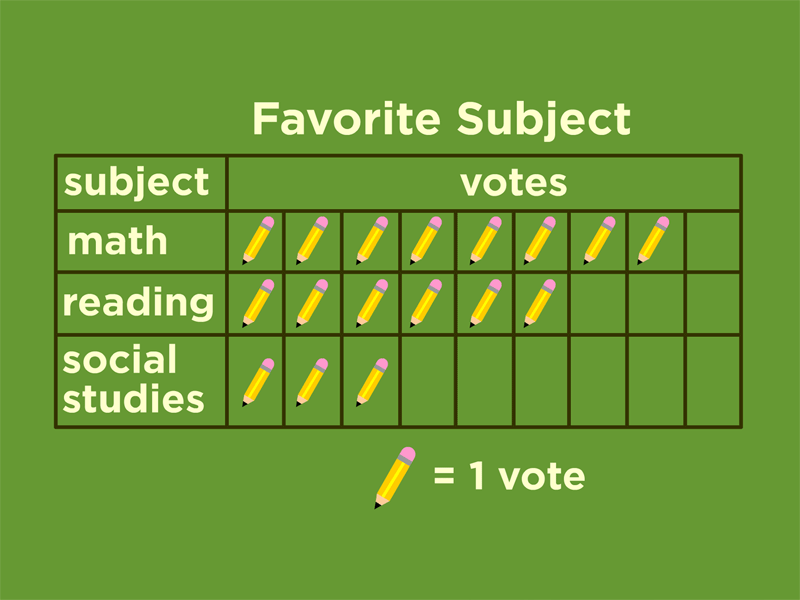
Which subject received the most votes?

a)

science

b)

reading

c)

social studies

d)

math

2.

Which subject received the least votes?

a)

Math

b)

Reading

c)

Social Studies

3.
How many votes did reading receive?
a)
2
b)
4
c)
6
d)
8
4.

What does one pencil stand for?

a)

1

b)

2

c)

5

d)

10

5.

What does one pawprint stand for?

a)

2 votes

b)

4 votes

c)

6 votes

d)

1 vote

6.

How many people voted for cat?

a)

2

b)

4

c)

6

d)

10

7.

How many people voted for cats and dogs?

a)

12

b)

14

c)

16

d)

20

8.
How many total votes were collected?
a)
5
b)
10
c)
15
d)
20
9.
How many more students played soccer than football?
a)
3
b)
30
c)
6
d)
60
10.
Which pizzeria has the second largest sales? 
a)
Pizza House
b)
Domiano's Pizza
c)
Little Secrets Pizza
d)
Uncle John's Pizza
11.

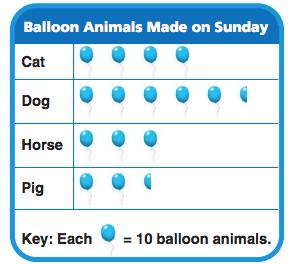
How many balloon animals did Landon make in all on Sunday?

a)

15

b)

140

c)

150

d)

160

12.
How many students take the bus to school?
a)
35
b)
20
c)
10
d)
15
13.
How many mountain bikes were sold?
a)
22
b)
28
c)
16
d)
6
14.
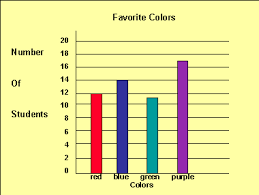
How many more people like red than purple?
a)
100
b)
10
c)
2
d)
5
15.
What type of graph is this?
a)
Bar Graph
b)
Line Plot
c)
Pictograph
d)
Tally Chart
16.
How many more people have purple for a favorite color than red?
a)
3
b)
5
c)
7
d)
9
17.
How many students like vanilla and chocolate?
a)
8
b)
32
c)
30
d)
28
18.
How many more students like soccer than basketball?
a)
24
b)
15
c)
10
d)
17
19.
The graph below shows the number of sunny days and rainy days in a city during four months.

Based on the graph,how many more sunny days than rainy days did this city have during the months of April, May, and June?

a)
21
b)
56
c)
26
d)
20
20.
Which day had more minutes of homework?
a)
Wednesday
b)
Thursday
c)
Friday
d)
Ms. Jones
21.
How many total people took the survey?
a)
50
b)
150
c)
100
d)
200
22.

How many more runs did Doug have than Sarah?

a)

6

b)

4

c)

5

d)

8

23.
What label is along the x-axis?
a)
Numbers
b)
Boys
c)
Sports
d)
Girls
24.
Which book series had the lowest amount of votes? How many students voted for that series?
a)
Diary of a Wimpy Kid, 60
b)
Percy Jackson, 15
c)
Percy Jackson, 25
d)
The Dork Diaries, 55
25.
How many students voted all together?
a)
230
b)
100
c)
210
d)
300
26.
Which book series is missing votes? Who's missing votes? How many votes are missing?
a)
Harry Potter, Boys, 15
b)
Percy Jackson, Boys, 30
c)
The Dork Diaries, Boys, 30
d)
Diary of a Wimpy Kid, Girls, 15
27.
What type of graph is this called?
a)
Double Bar Graph
b)
Pie Chart
c)
Coordinate Grid
d)
Bar Graph
28.

At what rate did the temperature decrease between the 20th and 25th minutes of the experiment?

a)

10°C in 5 min

b)

10°C in 10 min

c)

5°C in 5 min

d)

5°C in 10 min

29.

The graph shows the number of inches a plant grew each week.

Between which 2 weeks did the plant grow the MOST?

a)

Week 1 and Week 2

b)

Week 2 and Week 3

c)

Week 3 and Week 4

d)

Week 4 and Week 5

30.

Michael earns money by walking dogs for his neighbors. He recorded the number of dog-walking jobs he had each month for one year. The data are shown in the graph below.

During which month did Michael have 18 dog-walking jobs?

a)

July

b)

August

c)

October

d)

November

31.

Which month had the biggest difference between the high and low temperatures?

a)

January

b)

April

c)

October

d)

November

32.

Which day had the most popcorn sold?

a)

Monday

b)

Tuesday

c)

Wednesday

d)

Thursday

33.
How many push-ups were done on Monday?
a)
5
b)
10
c)
15
d)
20
34.
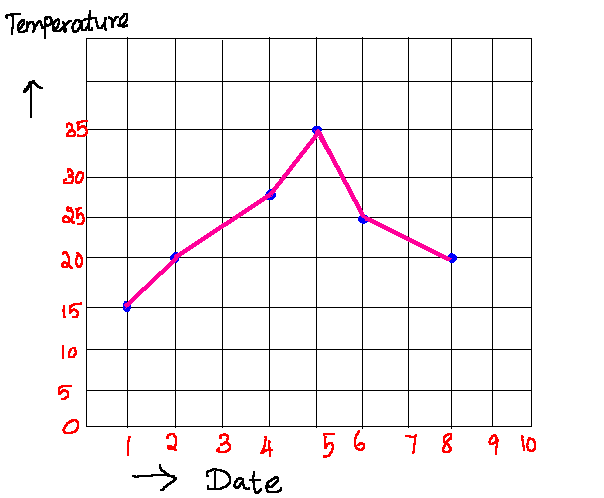
On which 2 days was the temperature the same?
a)
2 and 8
b)
1 and 6
c)
3 and 4
d)
5 and 8
35.
What is the name of this graph?
a)
line plot
b)
line graph
c)
bar graph
d)
frequency table
36.
What label is along the y-axis in this graph?
a)
Copyright 2007
b)
Lines
c)
Age in Years
d)
Number of Teens
37.
This double line graph for rainfall in two cities shows what pattern?
a)
Rain is steady all year.
b)
It is rainier in the summer months than in winter.
c)
It is the rainiest in winter.
d)
There is no rain.  Both cities are dry year round.
38.
People buy more drinks on ____ than any other day.
a)
Monday
b)
Tuesday
c)
Thursday
d)
Friday
39.
This double line graph shows average rainfall in two cities. What is the greatest difference between the two cities?
a)
4 feet
b)
5 inches
c)
3 inches
d)
4 inches
40.
Which day of the week had the lowest high and low temperature?
a)
Monday
b)
Thursday
c)
Tuesday
d)
Wednesday
41.

The total number of horses and pigs Nate has is equal to the number of which other kind of animal?

a)

Chicken

b)

Sheep

c)

Cows

d)

Horses

42.

How many farm animals in all are on Nate's farm?

a)

21

b)

12

c)

17

d)

27

43.
What did I forget to put on this bar graph?
a)
The scale
b)
The titles
c)
The pictures
d)
The key
44.
How many children chose grapes?
a)
10
b)
7
c)
2
d)
6
45.
Name two fruits that were chosen by a total of 12 people.
a)
apple and pear
b)
apple and grapes
c)
apple and banana
46.
What was the bear population in 2001?
a)
40
b)
45
c)
50
d)
55
47.
When was the greatest amount of shoppers at the store?
a)
10am
b)
1pm
c)
6pm
d)
2pm
48.
Which axis runs vertically?
a)
x
b)
Y
49.
Which axis runs horizontally?
a)
x
b)
y
50.
What is the maximum value of the data?
a)
82
b)
85
c)
70
d)
65