wayground logo

Free Printable Worksheets

Font size

S
M
L
XL
Worksheets

Slope Review

Total questions: 56

Worksheet time: 3hrs 32mins

Name
Class
Date
1.

What does slope describe?

a)

Slope describes growth.

b)

Slope describes the rate of change.

c)

Slope describes steepness of a line.

d)

Slope describes direction (positive/negative).

2.

The equation of a line is usually written in the form: y=mx+b

Which part of the equation represents the slope/growth?

a)

y

b)

m

c)

x

d)

b

3.

The equation of a line is usually written in the form: y=mx+b

Which part of the equation represents the y-intercept/figure zero tiles?

a)

y

b)

m

c)

x

d)

b

4.

What type of slope does the line in the picture have?

a)

Positive Slope

b)

Negative Slope

c)

Zero Slope

5.

What type of slope does the line in the picture have?

a)

Positive Slope

b)

Negative Slope

c)

Zero Slope

6.

What type of slope does the line in the picture have?

a)

Positive Slope

b)

Negative Slope

c)

Zero Slope

7.

What is the slope of the line with the equation: y = 3x - 1 ?

a)

-3

b)

-1

c)

1

d)

3

8.

What is the y-intercept of the line with the equation: y = 3x - 1 ?

a)

-3

b)

-1

c)

1

d)

3

9.

Calculate the slope from the table given.

a)

-2

b)

2

c)

4

d)

6

10.

Calculate the slope from the graph given.

a)

6

b)

3/2

c)

2

d)

6/9

11.

Calculate the slope from the graph given.

a)

-2

b)

-1/2

c)

1/2

d)

2

12.

Which part of the slope triangle represents delta x (change in x)?

a)

The blue line.

b)

The green line.

c)

The red line.

13.

Which part of the slope triangle represents delta y (change in y)?

a)

The blue line.

b)

The green line.

c)

The red line.

14.

What is the slope of the given line?

a)

2

b)

1/2

c)

-2

d)

-1/2

15.

Which line is steeper?

a)

The red line.

b)

The blue line.

16.

Is the equation y = 4x - 2 correct for the given line?

a)

Yes

b)

No

17.

Is the equation y = (1/2)x + 3 correct for the given line?

a)

Yes

b)

No

18.

What is the equation of the given line?

a)

y = (1/2)x + 3

b)

y = (-1/2)x + 3

c)

y = -2x + 3

d)

y = -2x

19.

What is the equation of the given line?

a)

y = x - 1

b)

y = -x - 1

c)

y = x + 1

d)

y = x

20.
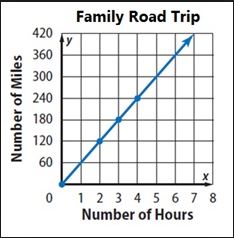
What is the unit rate in this proportional relationship?
a)
60 miles/1 hour
b)
120 miles/ 2 hours
c)
1 mile/ 1 hour
21.
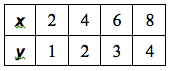
Which statement best describes the relationship between x and y in the table?
a)
Proportional
b)
Not Proportional
22.
Which graph is non-proportional?
a)
A
b)
B
c)
C
d)
D
23.
What is the constant of proportionality (in miles per hour) based on the table?
a)
45
b)
90
c)
135
d)
2
24.
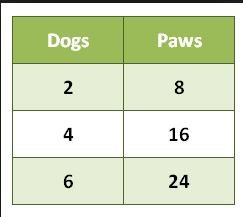
Is this table proportional?
a)
Yes
b)
No
25.
Is this graph proportional?
a)
Yes
b)
No
26.
Find the unit rate:  $3.60 for 3 pounds of apples. How much does it cost for 1 pound of apples?
a)
$1.00 per pound
b)
$3.60 per pound
c)
$1.20 per pound
d)
$1.10 per pound
27.
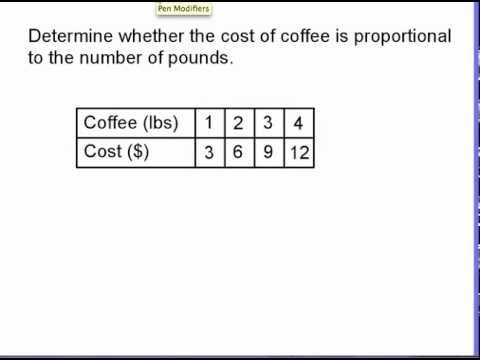
Does the table represent a proportional relationship?
a)
Yes.
b)
No.
28.
Does the table represent a proportional relationship?
a)
Yes.
b)
No.
29.
What makes a graph proportional?
a)
Linear
b)
The line goes through the origin
c)
Curvy line
d)
Linear and the line goes through the origin
30.
The team scored 50 points. How many points did Kendrick score?
a)
12 points
b)
20 points
c)
10 points
d)
72 points
31.
There are 200 vegetable plants in a garden.  How many of the vegetable plants are green beans?
a)
16
b)
24
c)
28
d)
32
32.
How many total people took the survey?
a)
50
b)
150
c)
100
d)
200
33.
What percent of people chose snickers as their favorite candy?
a)
about 33%
b)
about 20%
c)
about 3%
d)
None of these
34.
When a circle graph is completed correctly, the percentages on the graph should add up to...
a)
180 Degrees
b)
100%
c)
99%
d)
360 Degrees
35.
According to this circle graph, what is the least popular flavor of Jolly Rancher?
a)
Blue Rasberry
b)
Watermelon
c)
Grape
d)
Apple
36.
According to this graph, what is the most popular flavor of Jolly Rancher?
a)
Cherry
b)
Grape 
c)
Blue Rasberry
d)
Watermelon
37.
According to this graph, for every 24 hours, about how many hours are spent watching TV?
a)
0 hours
b)
5 hours
c)
13 hours
d)
3 hours
38.

The circle graph shows the percentages of a family budget used for different monthly expenses.

Which statement is supported by the data in the graph?

a)

The amount of money budgeted for Food is half the amount budgeted for Fun

b)

The amount of money budgeted for Savings and Utilities combined is twice the amount budgeted for Mortgage

c)

The amount of money budgeted for Mortgage is greater than the amount budgeted for Savings and Utilities combined

d)

The amount of money budgeted for Saving and Food combined is greater than the amount for Fun and Utilities combined.

39.

Solve for x

a)

x=4

b)

x=-4

c)

x=24

d)

x=-24

40.

Solve for x:

a)

x=1

b)

x=3

c)

x=15

d)

x=6

41.

Solve for x:

a)

x=1/2

b)

x=4

c)

x=1/4

d)

x=2

42.

Solve for x:

a)

x=0

b)

x=5/4

c)

x=1

d)

x=3/4

43.
8v - 4(v + 8) = 8
a)
2
b)
10
c)
4
d)
-4 
44.
solve for w
a)
8/3
b)
32/3
c)
5/8
d)
-9/8
45.
The scatter plot shows the relationship between the number of chapters and the total number of pages for several books.  Use the trend line to predict how many chapters would be in a book with 180 pages. 
a)
12 chapters
b)
15 chapters
c)
18 chapters
d)
21 chapters
46.
Describe the correlation in the graph shown.
a)
Strong Negative
b)
Strong Positive
c)
Weak Negative
d)
Weak Positive
47.
What type of correlation does this scatter plot show?
a)
positive 
b)
negative
c)
no correlation
d)
nonlinear association
48.
Describe the correlation in the graph shown.
a)
Strong Negative
b)
Strong Positive
c)
Weak Negative
d)
Weak Positive
49.
Describe the correlation in the graph shown.
a)
Strong Negative
b)
Strong Positive
c)
Weak Negative
d)
Weak Positive
50.

What type of correlation does this graph have?

a)

Strong Positive

b)

Weak Positive

c)

No Association

d)

All of the above.

51.

What is the type of correlation?

a)

Negative

b)

No Association

c)

Positive

52.
Which scatter plot shows a linear relationship between x and y?
a)
Graph A
b)
Graph B
c)
Graph C
d)
Graph D
53.
Which of the following lines represents the line of best fit for the scatter plot?
a)
A
b)
B
c)
C
d)
D
54.

What's the y-intercept for the line of best fit for the scatter plot?

a)

35

b)

50

c)

30

d)

20

55.
Which sentence describes the relationship shown on this scatter plot?
a)
As the temperature decreases, the visitors increase. 
b)
As the temperature increases, the number of visitors increases. 
c)
As the visitors increase, the temperature decreases. 
d)
No correlation
56.
What is a line of best fit used for?
a)
To make predictions
b)
To make the graph look pretty
c)
To connect the points
d)
To make it look like you know what you are doing