
 Worksheets
3rd Grade Graphing
Total questions: 53
Worksheet time: 1hrs 12mins
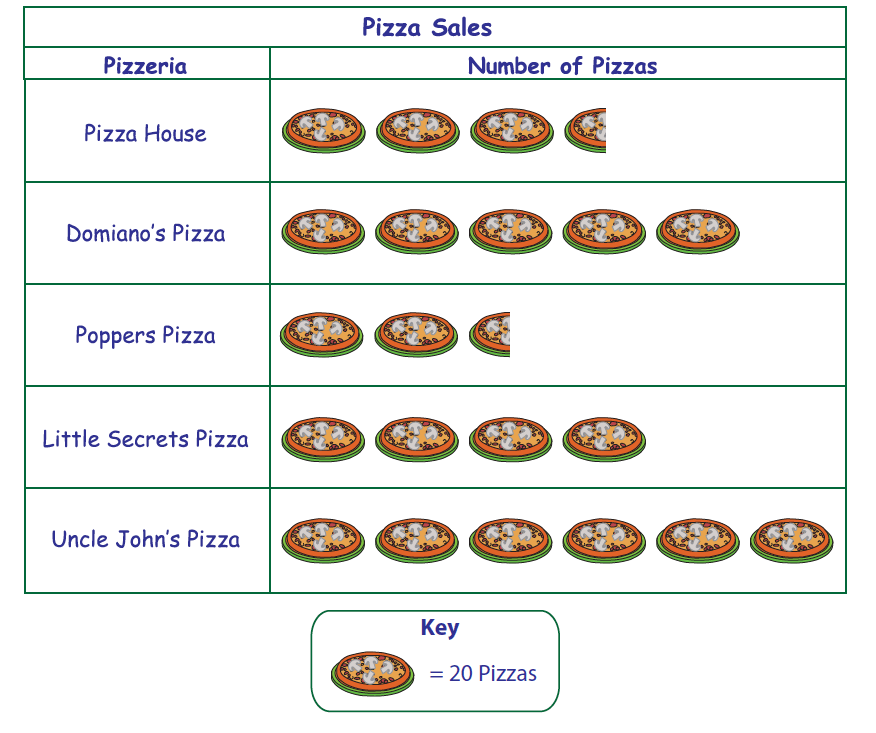
How many pizzas were sold by Domiano’s Pizza and Little Secrets Pizza?
180
200
210
45










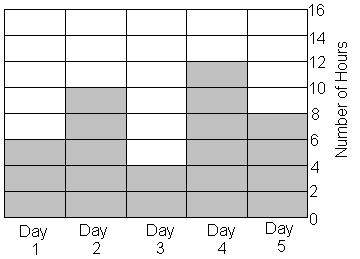
Jamie practiced for her piano recital for 5 days in a row.
What is the sum of hours she practiced on Day 1 and Day 3?
1
2
5
10


How many more runs did Doug have than Sarah?
6
4
5
8



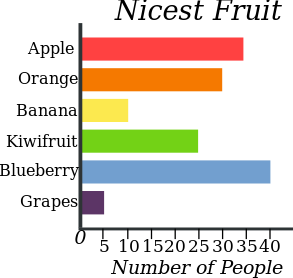

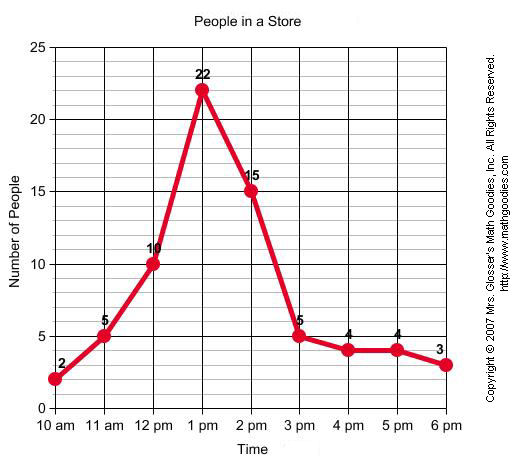


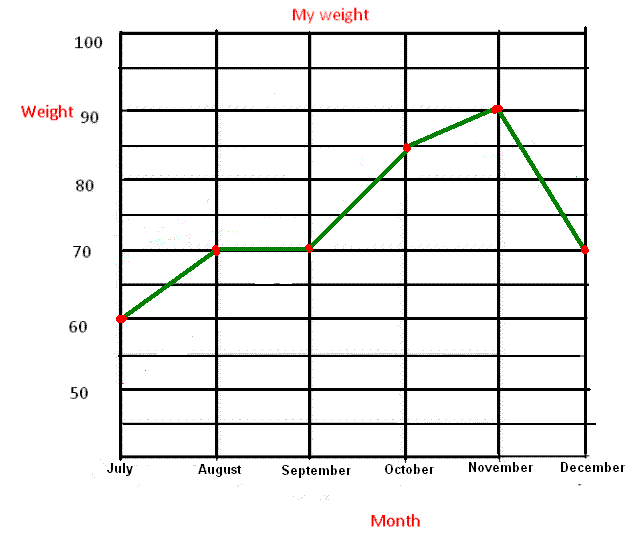


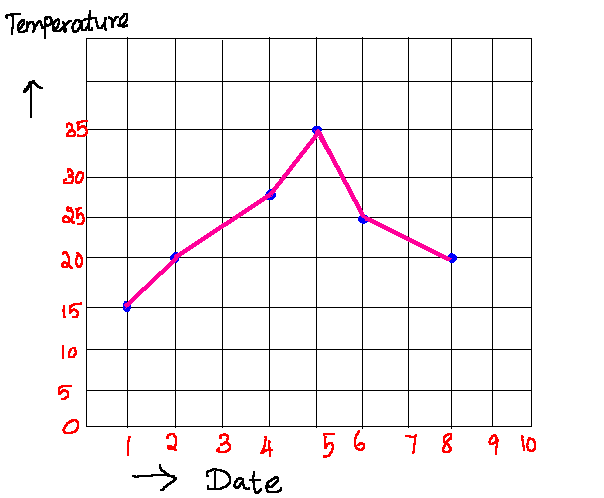

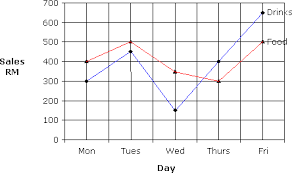
Look at the graph.
From Tuesday to Wednesday there is ....
a sharp rise.
no change.
a sharp fall.
nothing.


A restaurant recorded the number of pizzas sold each month for one year. The data are shown in the graph below. During which month did the restaurant sell 40 pizzas?
March
May
July
August

Annie recorded the amount of rain that fell each day. The results are shown in the line graph below. How many centimeters of rain fell on the third day?
2
3
4
7

The graph shows the number of inches a plant grew each week.
Between which 2 weeks did the plant grow the MOST?
Week 1 and Week 2
Week 2 and Week 3
Week 3 and Week 4
Week 4 and Week 5





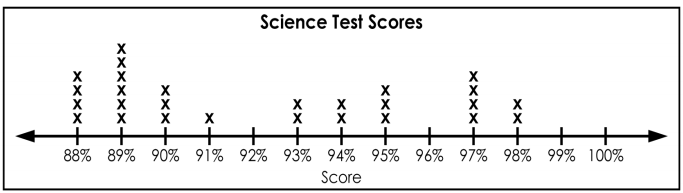
How many more students scored a 88 than scored a 98?
4
2
6
35



