
NEW
Font size
 Worksheets
Bar Graphs & Pictographs
Total questions: 10
Worksheet time: 10mins
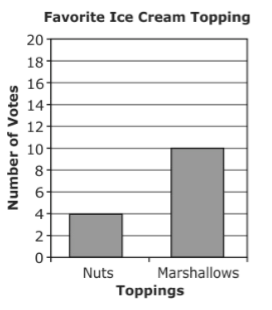
Students voted for their favorite ice cream topping. How many more students chose marshmallows than chose nuts?
4
6
10
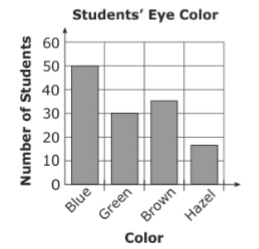
Miss Lee's science class collected data on the color of 3rd grade student's eyes. The students created a bar graph with this information. How many more students had blue eyes than green eyes?
80
50
30
20

Jack made this graph to show the number of movies that were rented from his store during four months. Which whole number shows how many more movies were rented in December than in September?
20
35
45
80

The bar graph shows the number of hamburgers sold at Bob’s Burger Shack. On which days were more than 80 hamburgers sold?
Wednesday and Friday
Tuesday and Thursday
Monday, Tuesday, and Thursday
Tuesday, Wednesday, Thursday, and Friday

The graph shows the number of colored beads used to make a necklace. How many purple and green beads were used in all?
23
20
18
15



How many votes for Art?
2
3
6
8

How many votes for spelling?
2
4
6
8
How many votes for Art?
2
3
6
8

