
 Worksheets
Unit 7 Test Review
Total questions: 58
Worksheet time: 56mins
Name
Class
Date
1.

What type of graph is this?
a)
Bar Graph
b)
Histogram
c)
Line Plot
2.

What is the least value?
a)
52
b)
0
c)
13
d)
10
3.

How many people watched more than 6 hours of TV?
a)
10
b)
5
c)
20
d)
17
4.

Which interval has 400 employees?
a)
33-43
b)
0-10
c)
77-87
d)
66-76
5.

Which interval has the greatest number of employees?
a)
11-21
b)
33-43
c)
77-87
d)
44-54
6.

How many students scored between a 86 and a 90?
a)
1
b)
3
c)
6
d)
10
7.

How many students are between 48 and 51 inches tall?
a)
14
b)
8
c)
2
d)
0
8.

How many people watched between 6 and 10 hours of TV last week?
a)
31
b)
22
c)
15
d)
35
9.

Is this an example of a histogram?
a)
yes
b)
no
10.

What is the minimum value?
a)
64
b)
58
c)
66
d)
60
11.

What is the maximum value?
a)
58
b)
66
c)
64
d)
60
12.

What data value is the upper quartile (Q3)?
a)
64
b)
62
c)
66
d)
58
13.
Roger bowled 7 games last weekend. His scores are: 155, 165, 138, 172, 127, 193, 142. What is Roger's median score?
a)
127
b)
155
c)
156
d)
193
14.

What value is the lower quartile?
a)
66
b)
58
c)
60
d)
64
15.

What is the median?
a)
62
b)
58
c)
66
d)
60
16.

What is the interquartile range (IQR)?
a)
4
b)
64
c)
60
d)
8
17.

Which box and whisker plot has the highest median?
a)
Top plot
b)
Bottom plot
18.

What is the term for the median of the lower half of the data?
a)
Lower Quartile
b)
Upper Quartile
c)
Median
d)
Maximum
19.

What is the term for the median of the upper half of the data?
a)
Upper Quartile
b)
Lower Quartile
c)
Median
d)
Minimum
20.

What is the highest score in the class?
a)
88%
b)
100%
c)
13
d)
98%
21.

How many students received a score of 94%?
a)
94
b)
4
c)
1
d)
2
22.

How many total students are in the science class?
a)
13
b)
6
c)
27
d)
25
23.

What is the MODE of this data?
a)
90
b)
85, 90, and 95
c)
85 and 95
d)
None
24.

What is the MEDIAN of this data?
a)
65
b)
40
c)
915
d)
13
25.

What is the MEAN for this data?
a)
80
b)
1040
c)
13
d)
81
26.
Find the mean of these numbers:
5,11,2,12,4,2
5,11,2,12,4,2
a)
4.1
b)
6
c)
4.5
d)
4
27.
Find the mean of these numbers:
5,11,2,12,4,2
5,11,2,12,4,2
a)
4.1
b)
6
c)
4.5
d)
4
28.
Identify the outlier for the given data?
23, 34, 27, 7, 30, 26, 28, 31, 34
23, 34, 27, 7, 30, 26, 28, 31, 34
a)
7
b)
23
c)
31
d)
34
29.
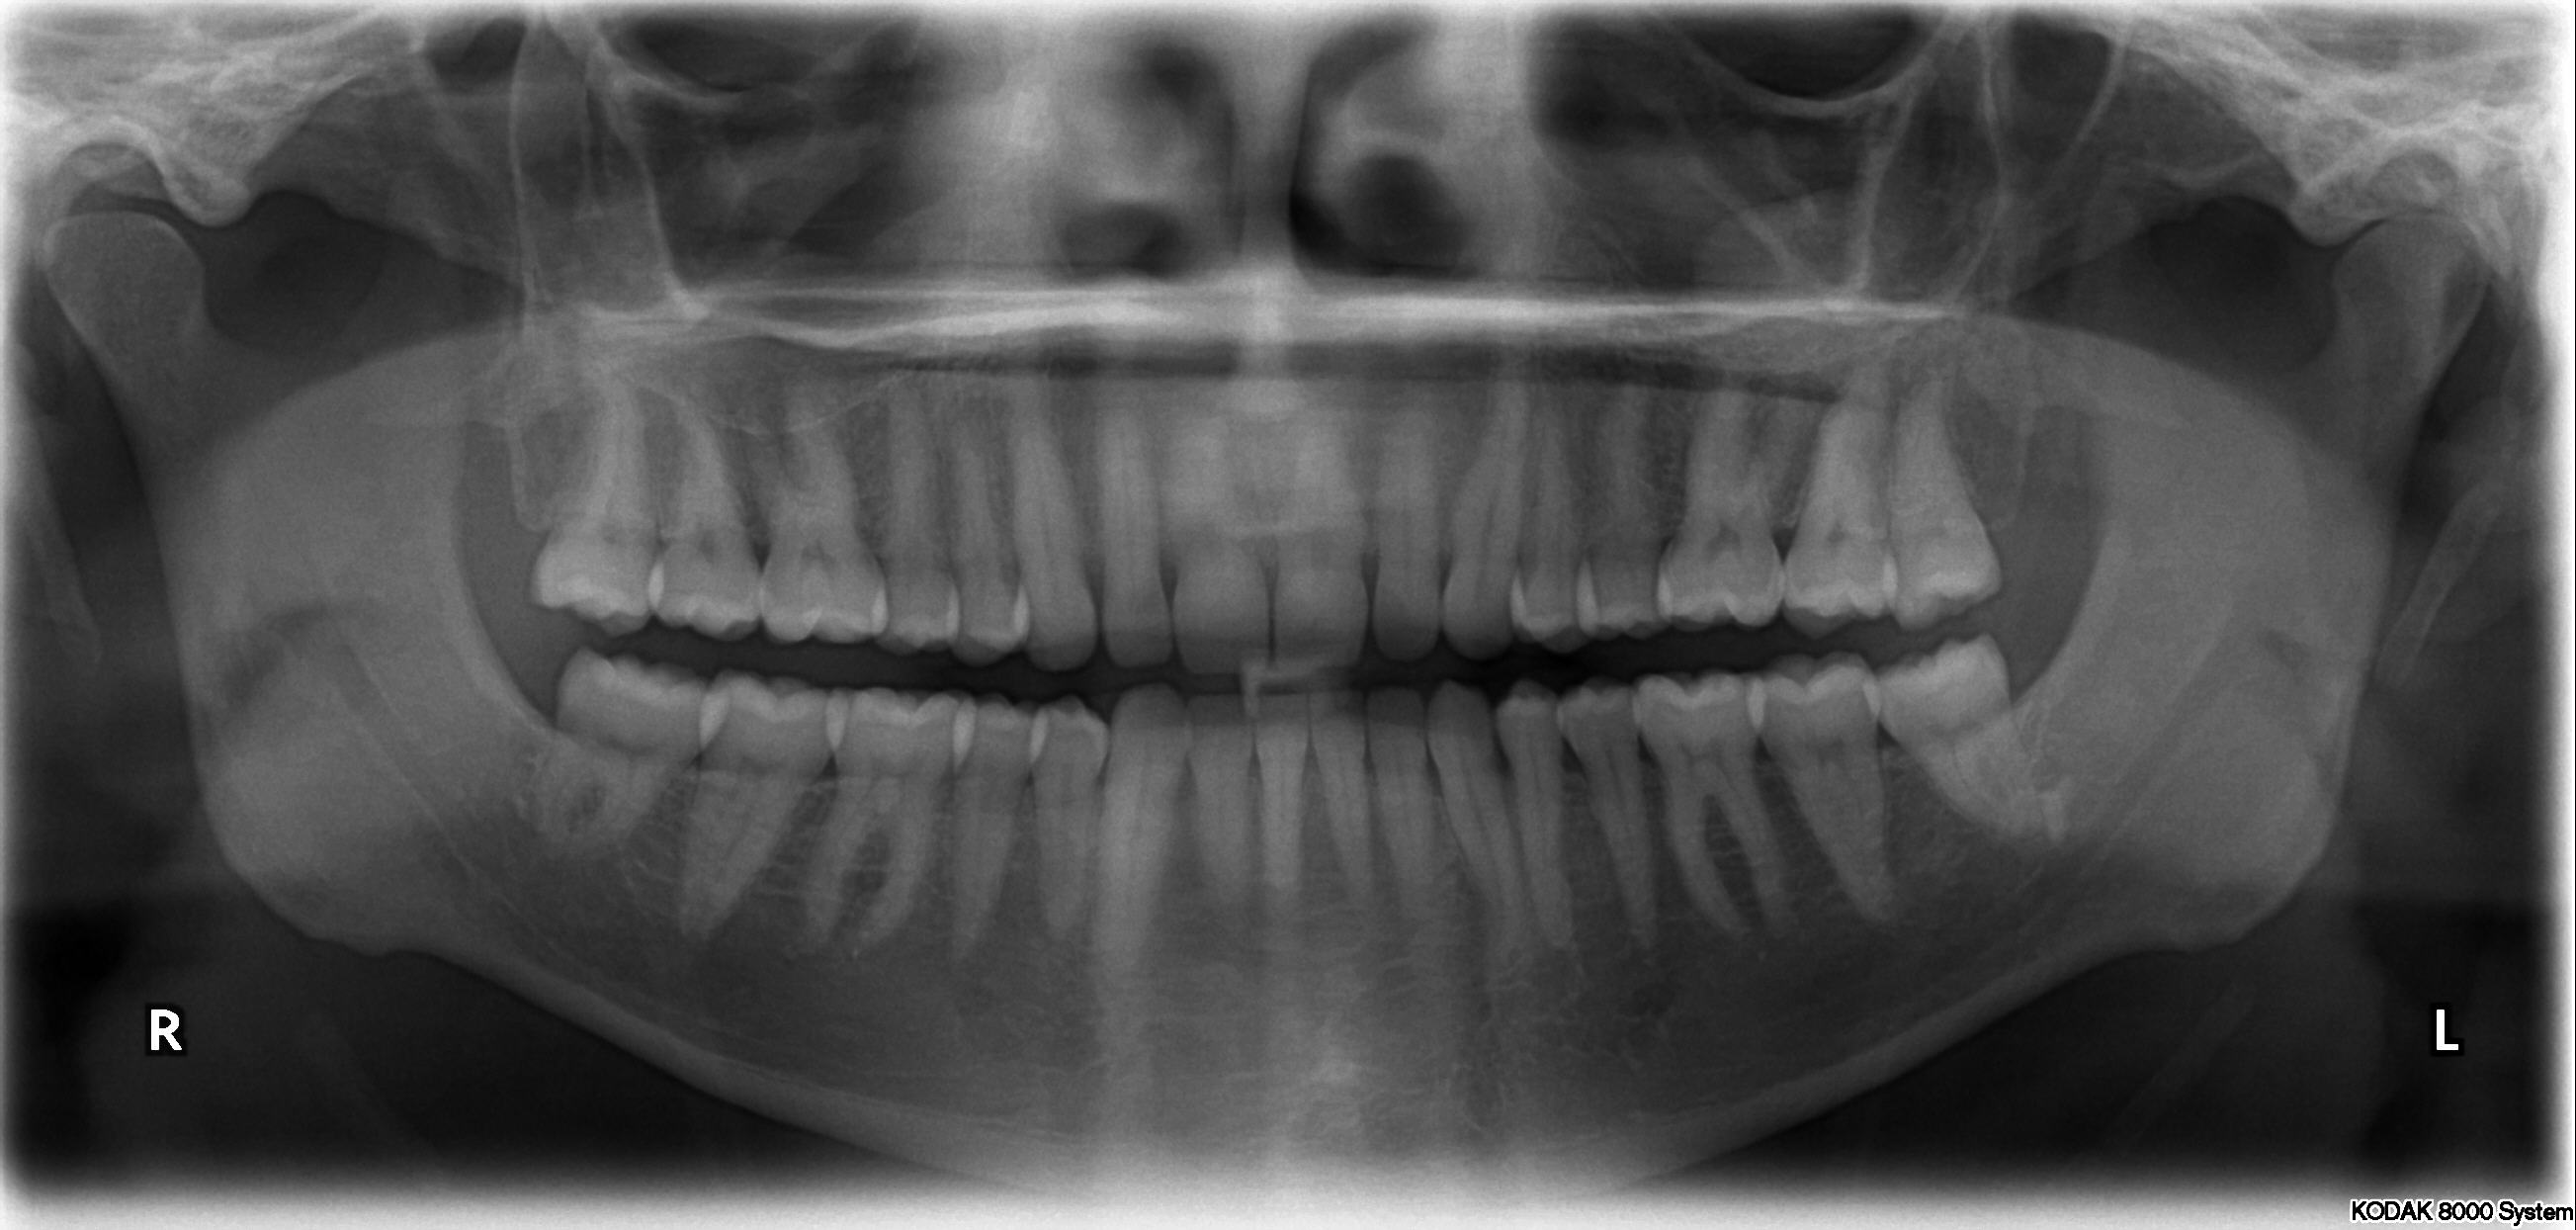
Dr. Dre is a dentist. He needs to report on the average (mean) number of cavities that his patients have.
1,0,1,5,6,3,4
1,0,1,5,6,3,4
a)
3.33
b)
2.85
c)
3
d)
3.5
30.
Find the mode of these numbers:
4,3,6,4,3,6,6,3,2,1,3
a)
3
b)
6
c)
4
d)
2
31.

What is the RANGE of this data
a)
40
b)
95
c)
90
d)
100
32.
What is the MEAN for this data?
a)
80
b)
1040
c)
13
d)
81
33.

What is the RANGE of this data?
a)
20
b)
90
c)
70
d)
80
34.

What is the MEDIAN of this data?
a)
90
b)
20
c)
80 and 90
d)
None
35.

What is the MEAN of this data? Round to the nearest hundredth
a)
85.77
b)
1115
c)
85
d)
13
36.

What color car is the least popular at this car dealership?
a)
Red
b)
White
c)
Blue
d)
Green
37.

How many sophomores like burritos and pizza?
a)
6
b)
5
c)
11
d)
50
38.

What food did the Sophmores eat the least of?
a)
Burrito
b)
Pizza
39.

How many skittles were in one bag?
a)
33
b)
32
c)
6
d)
7
40.

How many children participated in the survey?
a)
34
b)
30
c)
32
d)
6
41.

How many ladies from age 40-50 visited the library?
a)
8
b)
6
c)
7
d)
9
42.

How many students spent over 40 minutes but under 60 minutes studying?
a)
22 Students
b)
30 Students
c)
8 Students
d)
5 Students
43.
Find the mean:
28, 18, 19, 18, 17
28, 18, 19, 18, 17
a)
20
b)
18
c)
11
d)
19
44.
Find the mode:
5, 0, 9, 9, 3, 0, 5, 5, 4
5, 0, 9, 9, 3, 0, 5, 5, 4
a)
9
b)
5
c)
3
d)
7
45.
What is the definition of the range?
a)
The average
b)
The number that occurs the most
c)
The middle number
d)
The difference of the largest and smallest numbers
46.
Find the median:
5, 6, 3, 9, 0, 4, 1, 2, 7
5, 6, 3, 9, 0, 4, 1, 2, 7
a)
4
b)
4.1
c)
5
d)
4.5
47.
What is the definition of the mean?
a)
The average
b)
The middle number
c)
The difference between the highest and lowest numbers
d)
The number that occurs the most
48.
Can there be more than one mode?
a)
Yes
b)
No
49.
When finding the median, what do you do if there are two middle numbers?
a)
Add them together and divide by 2
b)
Write them both as the answer
c)
Give up
d)
Pick one
50.
Find the median:
3, 5, 7, 4, 3, 1
3, 5, 7, 4, 3, 1
a)
3 and 4
b)
There isn't one
c)
3.5
d)
3
51.
Find the mean:
3.8, 4.2, 4.0, 4.2, 4.2
3.8, 4.2, 4.0, 4.2, 4.2
a)
4.08
b)
20.4
c)
5.1
d)
4.2
52.
Find the median:
3.8, 4.2, 4.0, 4.2, 4.2
3.8, 4.2, 4.0, 4.2, 4.2
a)
4.2
b)
3.8
c)
4.0
53.
Find the mode:
3.8, 4.2, 4.0, 4.2, 4.2
3.8, 4.2, 4.0, 4.2, 4.2
a)
4.2
b)
3.8
c)
4.0
54.
Find the mean:
9, 9, 3, 2, 8, 7, 4
9, 9, 3, 2, 8, 7, 4
a)
49
b)
6
c)
9
d)
7
55.
Find the mode:
4, 5, 4, 3, 5, 1, 6
4, 5, 4, 3, 5, 1, 6
a)
4
b)
5
c)
4 & 5
d)
3
56.
Find the range:
24, 33, 43, 44, 23, 41, 40
24, 33, 43, 44, 23, 41, 40
a)
17
b)
21
c)
35
d)
20
57.

At Donald's Donuts the number of donut holes in a bag can vary. Help Donald find the mode.
12,10,10,10,13,12,11,13,10
12,10,10,10,13,12,11,13,10
a)
13
b)
12
c)
11
d)
10
58.
A data set can have more than one median?
a)
True
b)
False
100 %

