
 Worksheets
Frunzi Math
Total questions: 37
Worksheet time: 1hrs 14mins
Name
Class
Date
1.
n x n x n x n =
a)
n4
b)
4n
c)
nnnn
d)
4+n
2.

Solve WITHOUT a calculator.
a)
A.
b)
B.
c)
C.
d)
D.
3.

5(a + 6)
a)
5a + 6
b)
a + 30
c)
5a + 30
d)
5a - 30
4.

(b + 8)5
a)
b + 40
b)
5b - 40
c)
5b + 40
d)
5b + 8
5.

a)
A.
b)
B.
c)
C.
d)
D.
6.
Compare these Integers using the symbols:
< > =
-56 ____ -47
< > =
-56 ____ -47
a)
<
b)
>
c)
=
d)
⊕
7.
Compare these Integers using the symbols:
< > =
-5 ____ -7
< > =
-5 ____ -7
a)
<
b)
>
c)
=
8.
Compare these Integers using the symbols:
< > =
| -4 | _____ 4
< > =
| -4 | _____ 4
a)
<
b)
>
c)
=
9.
Compare these Integers using the symbols:
< > =
| -13 | ____ | 4 |
< > =
| -13 | ____ | 4 |
a)
<
b)
>
c)
=
10.

a)
A.
b)
B.
c)
C.
d)
D.
11.
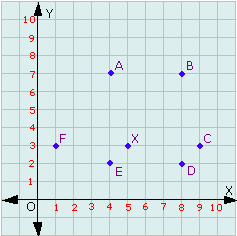
Where is Point A on the coordinate plane?
a)
(7,4)
b)
(1,3)
c)
(9,3)
d)
(4,7)
12.

a)
Point P
b)
Point Q
c)
Point R
d)
Point S
13.

a)
A.
b)
B.
c)
C.
d)
D.
14.
Simplify the ratio of
35 : 14
35 : 14
a)
5 : 2
b)
2 : 5
c)
3 : 1
d)
35: 14
15.
88 students for 4 classes
How many students per class?
How many students per class?
a)
22 students per class
b)
22 classes per student
c)
25 students per class
d)
25 classes per student
16.

a)
A.
b)
B.
c)
C.
d)
D.
17.
(19 - 7) ÷ 4 + 11
a)
14
b)
0.8
c)
15
d)
13
18.

a)
A.
b)
B.
c)
C.
d)
D.
19.
Identify the independent variable
The number of hours, h, worked and the amount of money, m, earned
a)
hours, h
b)
money, m
20.

a)
A.
b)
B.
c)
C.
d)
D.
21.

a)
Adding 65 centimeters to the thighbone length will result in the approximate height.
b)
Subtracting the approximate height from 65 centimeters will result in the thighbone length.
c)
Multiplying the thighbone by 2.6 and then adding 65 centimeters will result in the approximate height.
d)
Multiplying the approximate height by 2.6 and then adding 65 centimeters will result in the thighbone length.
22.

a)
3 cm2
b)
4 cm2
c)
12 cm2
d)
36 cm2
23.

a)
96
b)
104
c)
120
d)
168
24.

a)
b)
c)
d)
25.

What percent of the data is between 25 and 30 on the number line?
a)
25%
b)
`50%
c)
75%
d)
100%
26.

11. What percentage of the data is between 90 and 140?
a)
25 %
b)
50%
c)
75%
d)
100%
27.

What is the interquartile range (IQR)?
a)
4
b)
64
c)
60
d)
8
28.

Which box and whisker plot has the highest median?
a)
Top plot
b)
Bottom plot
29.

a)
b)
c)
d)
30.

Which interval has 400 employees?
a)
33-43
b)
0-10
c)
77-87
d)
66-76
31.

a)
b)
c)
d)
32.
Find the median.
12, 5, 9, 18, 22, 25, 5
12, 5, 9, 18, 22, 25, 5
a)
9
b)
8
c)
12
d)
18
33.
Find the mode.
12, 5, 9, 18, 22, 25, 5
12, 5, 9, 18, 22, 25, 5
a)
22
b)
18
c)
9
d)
5
34.
Find the range.
12, 5, 9, 18, 22, 25, 5
12, 5, 9, 18, 22, 25, 5
a)
20
b)
15
c)
22
d)
18
35.

a)
A.
b)
B.
c)
C.
d)
D.
36.

a)
A.
b)
B.
c)
C.
d)
D.
37.
What is m + m + m + m + m
a)
m5
b)
mmmmm
c)
5m
d)
m + 5
100 %

