wayground logo

Free Printable Worksheets

NEW

Font size

S
M
L
XL
Worksheets

A Quick Stat Review

Total questions: 20

Worksheet time: 23mins

Name
Class
Date
1.

A correlation value (r) that has a strong, positive linear association would have a value close to

a)

1

b)

0

c)

-1

d)

Cannot be answered

2.
What kind of correlation?
a)
Positive
b)
Negative
c)
No
3.

Estimate the correlation coefficient for this scatterplot.

a)

A) r = 1.2

b)

B) r = 0.89

c)

C)r = 0

d)

D) r = -0.89

4.

Estimate the correlation coefficient for this scatterplot.

a)

A) r = -0.9

b)

B) r = 1

c)

C) r = 0.9

d)

D) r = -1

5.

Which with is the line of best fit?

a)

A) Black

b)

B) Orange

c)

C) Red

d)

D) Blue

6.

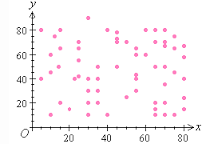
What type of correlation does this graph show?

a)

A) Positive

b)

B) negative

c)

C) none

d)

D) all of the above

7.

The scatter plot below shows the number of books read by students in Mrs. Hall’s English class and their final grades. Which statement represents the best description about the line of best fit?

a)

A) The more books students read, the lower their English grade.

b)

B) The more books students read, the higher their English grade.

c)

C) The fewer books students read, the higher their English grade.

d)

D) No relationship exists between the number of books students read and their English grades.

8.

Shape?

a)

Skewed right

b)

Skewed left

c)

Symmetric

d)

Normal

9.
The equation of the trend line
is  y= 1/2x +1

How many laps can a bicycle
make around the park in
23 minutes?    
a)
44 laps
b)
12 1/2 laps
c)
23 laps
10.
As the age of the car increases, its value decreases. Which scatterplot represents this relationship?
a)
A
b)
B
c)
C
d)
D
11.
Which example shows a CORRELATION?
a)
It rained and the ground is wet.
b)
Ice cream sales increase as temperature increases.
12.

Janice is saving money for retirement. The equation y = 500x + 12,000 models her retirement savings where y is the total she has saved in dollars, and x is the number of months.


Interpret the y-intercept.

a)

Janice started with $500 in her account

b)

Janice started with $12,000 in her account

c)

Each month, Janice saves an additional $500

d)

Each month, Janice saves an additional $12,000

13.
Data was collected on the weight of a male  laboratory rat for the first 25 weeks after its birth. The linear regression equation is 
y= 40x+100, where x is number of weeks and y is weight in grams. 
What does the y-intercept mean in context of the problem?
a)
The predicted weight of the rat in year 0. 
b)
The predicted weight of the rat at birth. 
c)
The current weight of the rat. 
d)
The average increase in the rat's weight. 
14.
What is the meaning of the slope?
a)
The cost to get into the fair is $5
b)
The total cost for the day will increase by $1.75 for every ride you go on.
c)
The cost to get into the fair is $1.75
d)
The total cost for the day will increase by $5 for every ride you go on. 
15.
What is the meaning of the slope?
a)
Her bill will increase by $2.95 for every grandchild she brings.
b)
The cost for Mrs. Franklin's meal is $6.85
c)
Her bill will increase by $6.85 for every grandchild she brings.
d)
The cost for Mrs. Franklin's meal is $2.95
16.
Which statement best represents this relationship?
a)
There is no relationship between the number of miles driven and the amount of gas remaining in the tank
b)
As the number of miles driven increases, the amount of gas remaining in the tank increases.
c)
As the number of miles driven increases, the amount of gas remaining in the tank decreases.
d)
A relationship cannot be determined from this scatter plot
17.

A data set can have more than one median. True or false?

a)

True

b)

False

18.
A data value that is much higher or much lower than the other values in a data set.
a)
outlier
b)
inlier
c)
immalier
d)
sublier
19.

Describe the shape of the graph.

a)

Skewed right

b)

Skewed left

c)

Random

d)

Symmetrical

20.
Describe the shape of the graph.
a)
Skewed right
b)
Skewed left
c)
Uniform
d)
Symmetrical