wayground logo

Free Printable Worksheets

NEW

Font size

S
M
L
XL
Worksheets

Motion graph shapes

Total questions: 21

Worksheet time: 13mins
Name
Class
Date
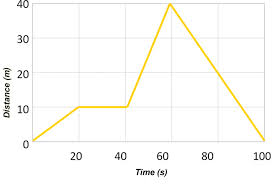
1.
How long did it take this object to travel 10 m?
a)
0 s
b)
10 s
c)
15 s
d)
20 s
2.
At 60 seconds, how far had this object traveled? 
a)
0 m
b)
10 m
c)
20 m
d)
40 m
3.

Which of the following is the correct equation for calculating SPEED?

a)

s = d / t

b)

s = d x t

c)

s = t / d

d)

s = d - t

4.
How many times does this object STOP moving?
a)
None
b)
Once
c)
Twice
d)
Three times
5.

Compare part DE to part OA?

a)

The object is accelerating quicker in part OA

b)

The object is accelerating slower in part OA

c)

The object is moving at a faster constant speed in part OA

d)

The object is moving at a slower constant speed in part OA

6.
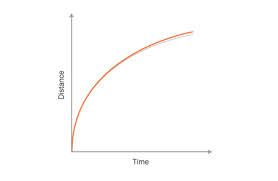
What is this graph showing?
a)
Constant Speed
b)
Acceleration (speeding up)
c)
Deceleration (slowing down)
d)
No motion
7.
What is this graph showing?
a)
Constant Speed
b)
Acceleration (speeding up)
c)
Deceleration (slowing down)
d)
No motion
8.
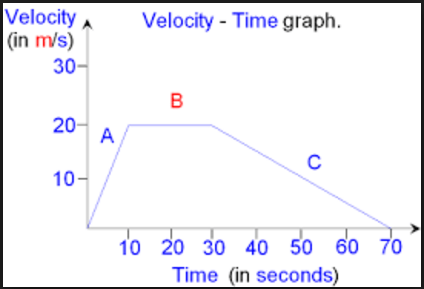
This is a velocity-time graph.  What is the object doing in segment B?
a)
Positive acceleration
b)
Negative acceleration
c)
Constant Velocity
d)
Not moving
9.
What kind of acceleration is shown here?
a)
positive
b)
negative
c)
none
d)
varies
10.
This is a velocity-time graph.  What is the object doing in segment A?
a)
Positive acceleration
b)
Negative acceleration
c)
Constant Velocity
d)
Not moving
11.
Bill runs 400 meters to Andy's house, turns around, and runs 400 meters back home.  What is Bill's distance?
a)
0 meters
b)
400 meters
c)
800 meters
d)
1600 meters
12.
What is this graph showing?
a)
Constant Speed
b)
Acceleration (speeding up)
c)
Deceleration (slowing down)
d)
No motion
13.
The lines represent the how the displacement of 3 cars, A, B and C, vary over 5 seconds.
Which of the 3 cars is/are at rest?
a)
A
b)
B
c)
C
d)
B & C
14.

What is the formula for speed?

a)

speed = distance x time

b)

speed=distance / time

c)

speed = time / distance

d)

speed = distance + time

15.

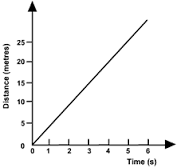
What is the line on this graph showing?

a)

moving away from starting point at a constant speed

b)

moving back towards the starting point at a constant speed

c)

acceleration (getting faster)

d)

deceleration (getting slower)

16.
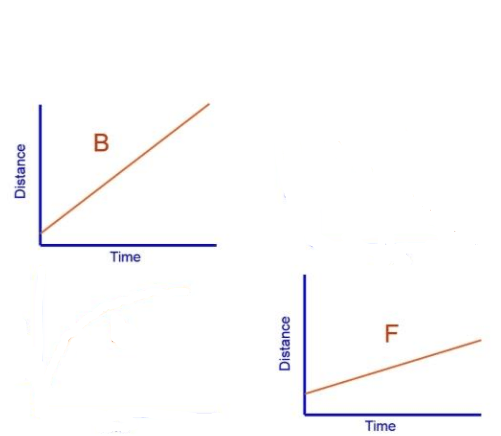
Which graph is showing a faster constant speed?
a)
B
b)
F
c)
They show the same speed
17.
Which runner stopped for a rest?
a)
Albert
b)
Bob
c)
Charlie
18.
Which runner won the race?
a)
Albert
b)
Bob
c)
Charlie
19.

What is happening between 3 seconds and 4 seconds?

a)

The object is accelerating

b)

The object is decelerating to a stop

c)

The object is returning to its original position

d)

The object is stationary

20.
Which runner had a head start?
a)
A
b)
B
c)
C
21.

What is occurring on this graph?

a)

speeding up in the positive direction

b)

moving at a constant speed in the positive direction

c)

not moving

d)

moving at a constant speed in the negative direction