wayground logo

Free Printable Worksheets

Font size

S
M
L
XL
Worksheets

AP Physics Distance/Displacement/Speed/Velocity

Total questions: 35

Worksheet time: 34mins

Name
Class
Date
1.
What is the total displacement of the object represented in this motion graph?
a)
5 meters
b)
4 meters
c)
2 meters
d)
0 meters
2.

What is the total distance of the object represented in this motion graph?

a)

5 meters

b)

4 meters

c)

2 meters

d)

0 meters

3.
What is the total distance of the object represented in this motion graph?
a)
0 meters
b)
10 meters
c)
11 meters
d)
20 meters
4.
What is the total displacement of the object represented in this motion graph?
a)
0 meters
b)
10 meters
c)
11 meters
d)
20 meters
5.
What is the total distance of the object represented in this motion graph? 
a)
50 meters
b)
- 50 meters
c)
150 meters
d)
100 meters
6.
What is the total displacement of the object represented in this motion graph? 
a)
0 meters
b)
- 50 meters
c)
50 meters
d)
100 meters
7.
What is the total distance of the object represented in this motion graph?
a)
0 meters
b)
300 meters
c)
450 meters
d)
600 meters
8.
What is the total displacement of the object represented in this motion graph?
a)
0 meters
b)
300 meters
c)
450 meters
d)
600 meters
9.
What is the total distance of the object represented in this motion graph?
a)
0 meters
b)
140 meters
c)
150 meters
d)
300 meters
10.
What is the total distance of the object represented in this motion graph?
a)
0 meters
b)
100 meters
c)
140 meters
d)
200 meters
11.
What is the total displacement of the object represented in this motion graph?
a)
0 meters
b)
100 meters
c)
140 meters
d)
200 meters
12.
What is the total displacement of the object represented in this motion graph?
a)
0 meters
b)
2 meters
c)
6 meters
d)
39 meters
13.

What is the total distance of the object represented in this motion graph?

a)

0 meters

b)

2 meters

c)

6 meters

d)

12 meters

14.
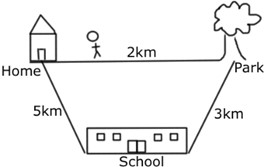
Jerry walked from home to school, then from the school to the park.  What is his total distance?
a)
2 km
b)
5 km
c)
8 km
d)
10 km
15.
Jerry walked from home to school, then from the school to the park.  What is his total displacement?
a)
2 km
b)
5 km
c)
8 km
d)
10 km
16.
Which of the following describes distance and displacement correctly?
a)
The blue arrow shows distance and the orange arrows show displacement
b)
The blue arrow shows displacement and the orange arrows show distance
c)
Both arrows show distance only
d)
Both arrows show distance and displacement
17.

Which is true?

a)

Speed is measured in m/s but velocity is measured in s/m

b)

Speed is a vector and velocity is a scalar

c)

Speed and velocity are the same exact thing

d)

Speed is like velocity but without a direction

18.

What is a difference between distance and displacement

a)

Distance is measured in seconds and displacement is measured in meters

b)

Distance is always shorter than displacement

c)

Displacement can be equal to zero if the object ends in the place it began in

d)

Distance can be equal to infinite when only a small distance has been travelled

19.
What does this graph represent?
a)
Constant speed
b)
Acceleration
c)
Not moving
20.
How many times does this object STOP moving?
a)
None
b)
Once
c)
Twice
d)
Three times
21.
What is the speed of this object at 3 seconds?
a)
5 m/s
b)
45 m/s
c)
5 s/m
d)
45 s/m
22.
What is the average speed of the person during the first 5 seconds?
a)
0 m/s
b)
1 m/s 
c)
3 m/s
d)
6 m/s 
23.
What is the object's velocity at 3 seconds?
a)
+3 m
b)
+5 m
c)
+5 m/s
d)
+1 m/s
24.

Which section shows the fastest constant speed?

a)

G

b)

D

c)

A

d)

F

25.
Describe the speed of the rocket in the speed vs. time graph.
a)
Constant speed
b)
Decreasing speed
c)
Increasing speed
d)
Not moving
26.
Describe the speed of the object from
2-5 seconds using the speed vs. time graph.
a)
Increasing speed
b)
Not moving
c)
Decreasing speed
d)
Constant speed
27.
Describe the speed of the object from
5-6 seconds using the speed vs. time graph
a)
Speeding up
b)
Slowing down
c)
Not moving
d)
Constant speed
28.
What is the velocity?
a)
not moving
b)
increasing
c)
positive
d)
negative
29.
What is the velocity?
a)
0 m/s
b)
positive m/s
c)
negative m/s
d)
decreasing
30.
What is the velocity?
a)
positive
b)
negative
c)
decreasing
d)
increasing
31.
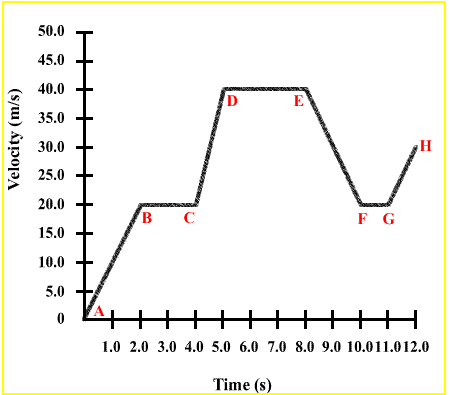
Which section of the graph shows decreasing velocity?
a)
CD
b)
DE
c)
EF
d)
GH
32.
Which section of the graph shows increasing velocity?
a)
AB
b)
BC
c)
DE
d)
EF
33.
Which section of the graph shows constant velocity?
a)
AB
b)
BC
c)
EF
d)
GH
34.
What would the d-t graph look like for an object travelling at a constant velocity? 
a)
Horizontal line
b)
Straight line
c)
Curved line
35.
What would the v-t graph look like for an object travelling at a constant velocity? 
a)
Curved line
b)
Straight line
c)
Horizontal line