
 Worksheets
Motion Test Review
Total questions: 23
Worksheet time: 36mins
Name
Class
Date
1.

What is the total displacement of the object represented in this motion graph?
a)
5 meters
b)
4 meters
c)
2 meters
d)
0 meters
2.
What is the total distance of the object represented in this motion graph?
a)
5 meters
b)
4 meters
c)
2 meters
d)
0 meters
3.

What is the total displacement of the object represented in this motion graph?
a)
0 meters
b)
10 meters
c)
11 meters
d)
20 meters
4.
A unusually fast zombie was chasing after Carl to eat him. What was the zombie’s speed at 6 seconds if he traveled 36 meters?
a)
6 meters/seconds
b)
6 seconds/meters
c)
.17 meters/second
d)
None of the above
5.

What is the formula to calculate speed?
a)
S = t/d
b)
S = d/t
c)
S = d x t
d)
S = t x d
6.
What is the equation to calculate time?
a)
time = speed/distance
b)
time = distance/speed
c)
time = speed x distance
d)
time = distance x speed
7.
What is the equation to calculate distance?
a)
distance = speed/time
b)
distance = time/speed
c)
distance = speed/distance
d)
distance = speed x time
8.
A car travels 30 miles/hr for 3 hours, calculate the distance it will travel
a)
90 miles
b)
10 miles
c)
600 miles
d)
90 km
9.
A speed boat travels 200 miles at a speed of 20 miles/hr. How much time will it take to travel the 200 miles?
a)
10 hrs
b)
10 miles
c)
400 hrs
d)
100 km
10.
Dave runs a 400 m race with a speed of 4 m/s. What time will it take him to finish the race?
a)
400 minutes
b)
100 minutes
c)
100 seconds
d)
.25 seconds
11.
Which of the following is a unit of distance ?
a)
miles/hr
b)
mi
c)
s
d)
min
12.
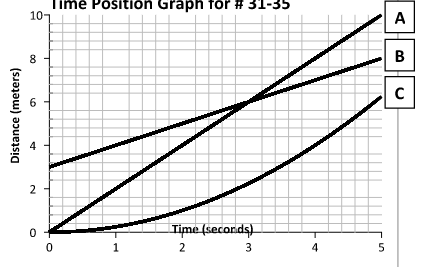
Which runner had a head start?
a)
A
b)
B
c)
C
13.
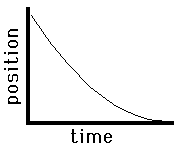
Describe the motion
a)
Slow to fast; Negative direction
b)
Fast to slow; Negative direction
c)
Fast to slow; Positive direction
d)
Slow to fast; Positive direction
14.

from 3rd second to 5th second, the object is
a)
moving at a constant speed
b)
speeding up
c)
not moving
d)
slowing down
15.

What does this graph represent?
a)
Constant speed
b)
Acceleration
c)
Not moving
16.
On a distance vs. time graph, the steeper the slope _____
a)
the slower the speed
b)
the faster the speed
c)
less acceleration
d)
greater acceleration
17.
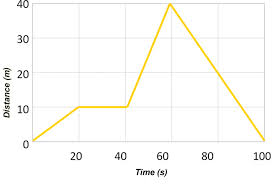
How long did it take this object to travel back to its reference/starting point?
a)
20 s
b)
30 s
c)
60 s
d)
100 s
18.
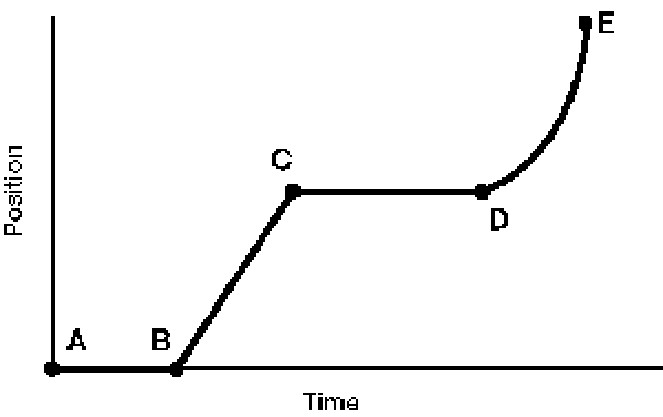
The speed of the object is changing during interval:
a)
A-B
b)
B-C
c)
C-D
d)
D-E
19.
From t=1.0 second to t=3.0 seconds, the object is
a)
moving at a constant speed
b)
speeding up
c)
not moving
d)
slowing down
20.

What kind of acceleration is shown here?
a)
positive
b)
negative
c)
none
d)
varies
21.

What kind of acceleration is shown here?
a)
positive
b)
negative
c)
none
d)
varies
22.

What is the velocity?
a)
not moving
b)
increasing
c)
positive
d)
negative
23.

Which section of the graph shows decreasing velocity?
a)
CD
b)
DE
c)
EF
d)
GH
100 %

