
 Worksheets
Graphing Revision
Total questions: 27
Worksheet time: 29mins
Name
Class
Date
1.
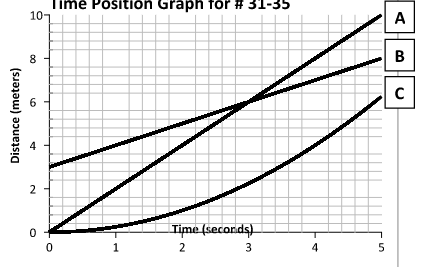
Which runner had a head start?
a)
A
b)
B
c)
C
d)
none
2.

from 3rd second to 5th second, the object is
a)
moving at a constant speed
b)
speeding up
c)
not moving
d)
slowing down
3.

What does this graph represent?
a)
Constant speed
b)
Acceleration
c)
Not moving
d)
Constant
4.
Velocity is
a)
speed
b)
direction
c)
speed with a direction
d)
scalar
5.
On a distance vs. time graph, the steeper the slope _____
a)
the slower the speed
b)
the faster the speed
c)
less acceleration
d)
greater acceleration
6.

What is the object's velocity at 3 seconds?
a)
+3 m
b)
+5 m
c)
+5 m/s
d)
+1 m/s
7.

What is happening between 4 and 5 seconds?
a)
The object is slowing down in a negative direction.
b)
The object is slowing down in a positive direction.
c)
The object is slowing down in a negative direction.
d)
The object is speeding up in a negative direction.
8.
What does the slope of a position vs. time graph represent?
a)
the car was going up a hill
b)
the velocity of the object
c)
how far the car moved
d)
how long it took the car
9.

According to the graph what is the total displacement?
a)
2 m
b)
10 m
c)
0 m
d)
5 m
10.
According to the graph how far does the person travel in the first 5 seconds?
a)
2 m
b)
10 m
c)
0 m
d)
5 m
11.

What kind of acceleration is shown here?
a)
positive
b)
negative
c)
none
d)
varies
12.

What kind of acceleration is shown here?
a)
positive
b)
negative
c)
none
d)
varies
13.

What is the velocity?
a)
not moving
b)
increasing
c)
positive
d)
negative
14.

What is the velocity?
a)
positive
b)
negative
c)
decreasing
d)
increasing
15.

Is the speed constant or non-constant?
a)
constant
b)
non-constant
16.

Which section of the graph shows decreasing velocity?
a)
CD
b)
DE
c)
EF
d)
GH
17.

Which section of the graph shows increasing velocity?
a)
AB
b)
BC
c)
DE
d)
EF
18.
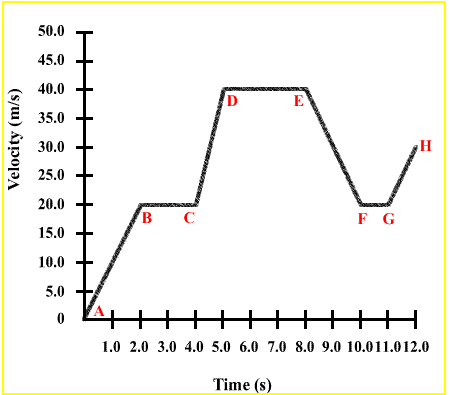
Which section of the graph shows constant velocity?
a)
AB
b)
BC
c)
EF
d)
GH
19.
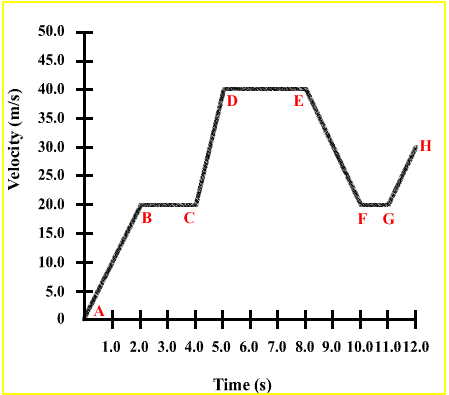
Which section of the graph shows acceleration?
a)
AB
b)
BC
c)
EF
d)
FG
20.

Which section of the graph shows deceleration?
a)
AB
b)
BC
c)
EF
d)
GH
21.

The letter "A" shows...
a)
A person returning to a starting point
b)
A person walking away from a starting point
c)
A person not moving
d)
A person resting
22.
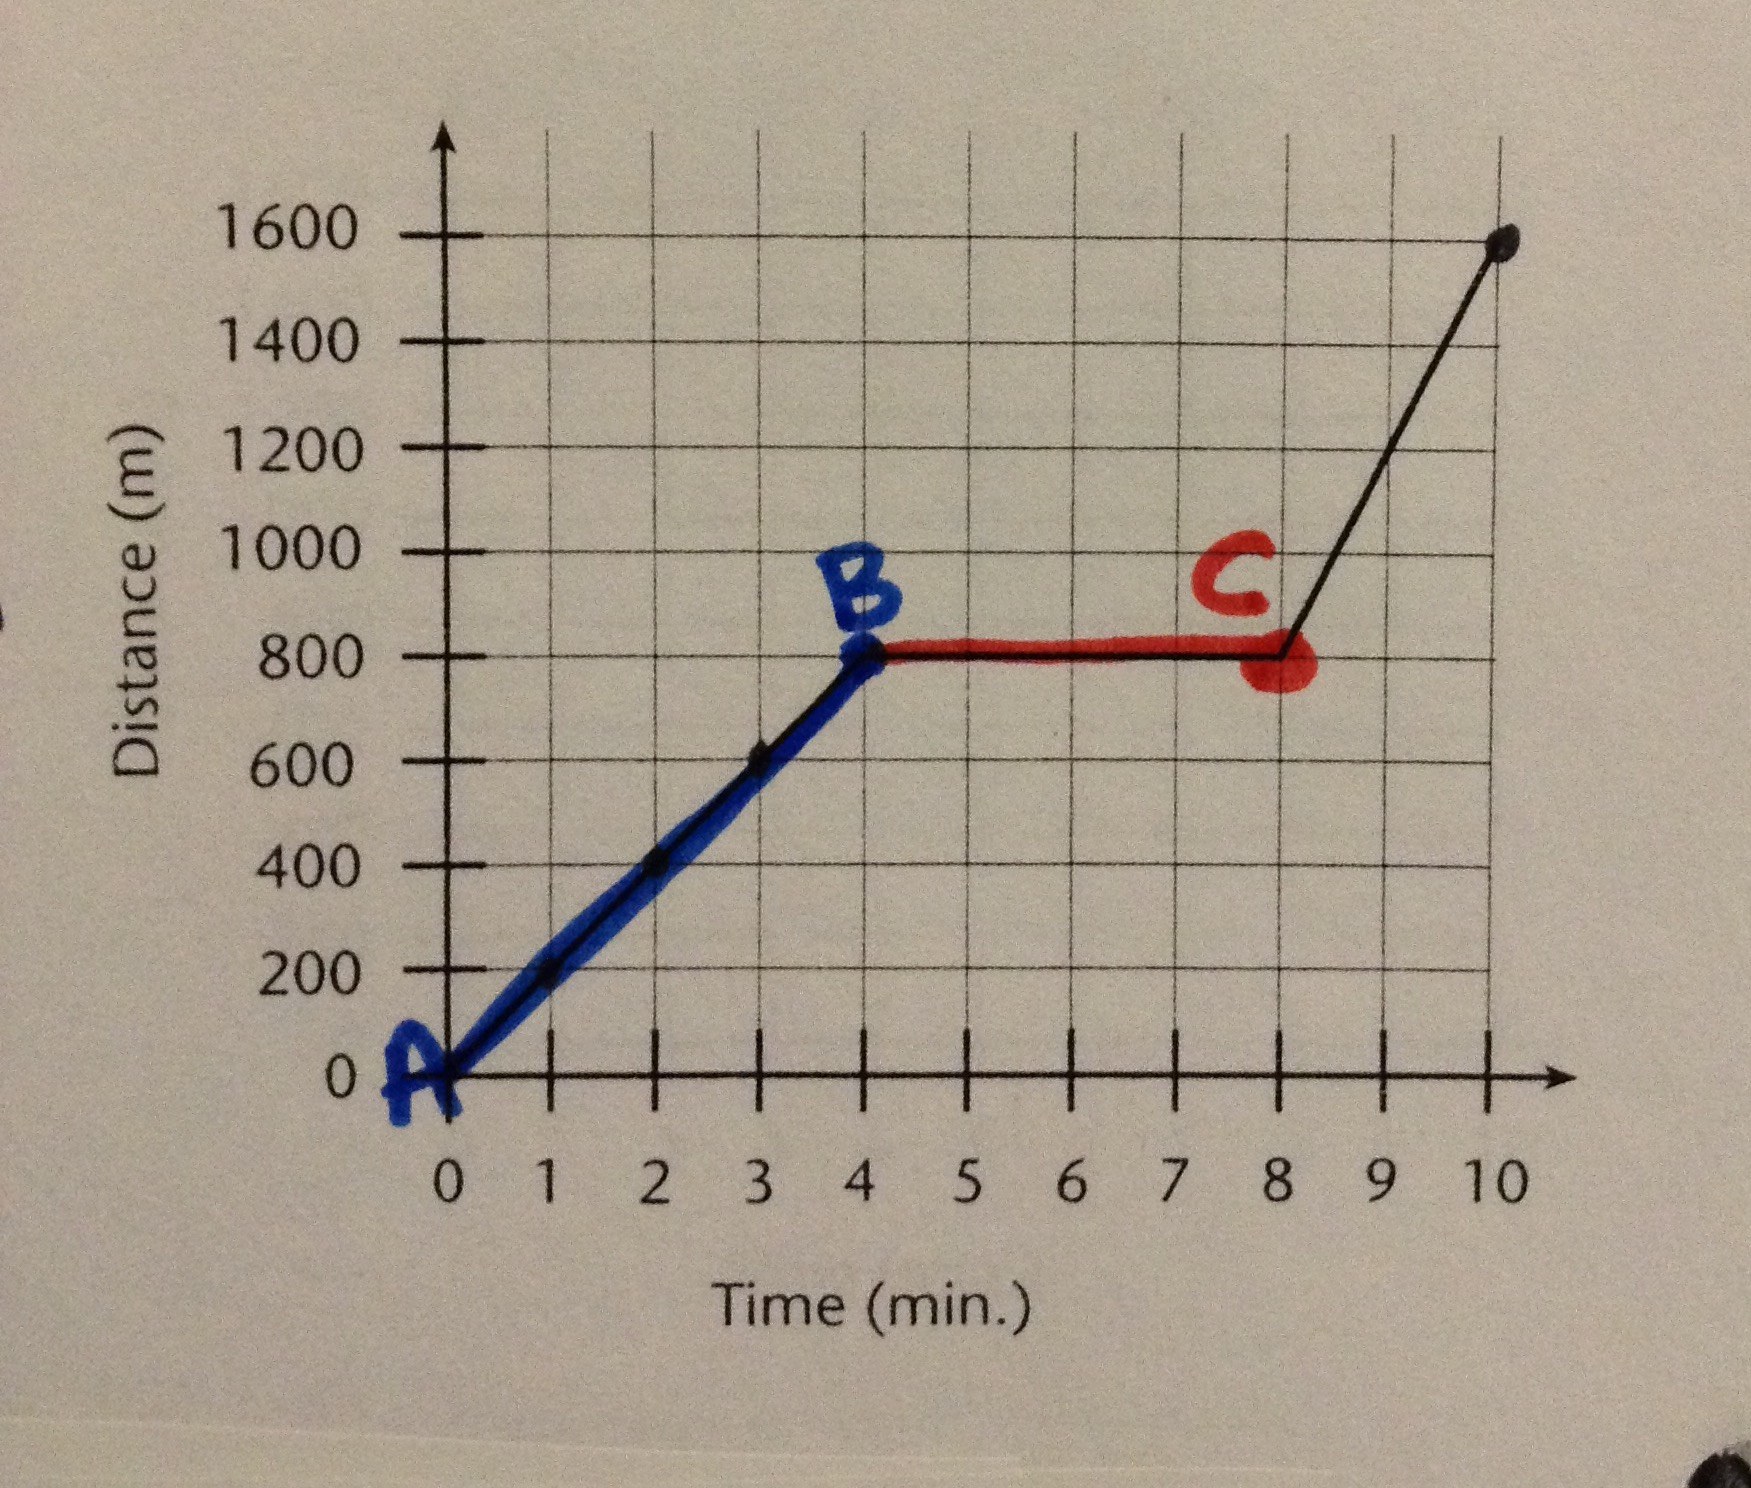
The graph shows Ashley riding her bike to Maria's house.
What is occurring from point A to point B?
What is occurring from point A to point B?
a)
they are traveling at a constant speed
b)
they are decreasing in speed
c)
they stopped to take a break
23.
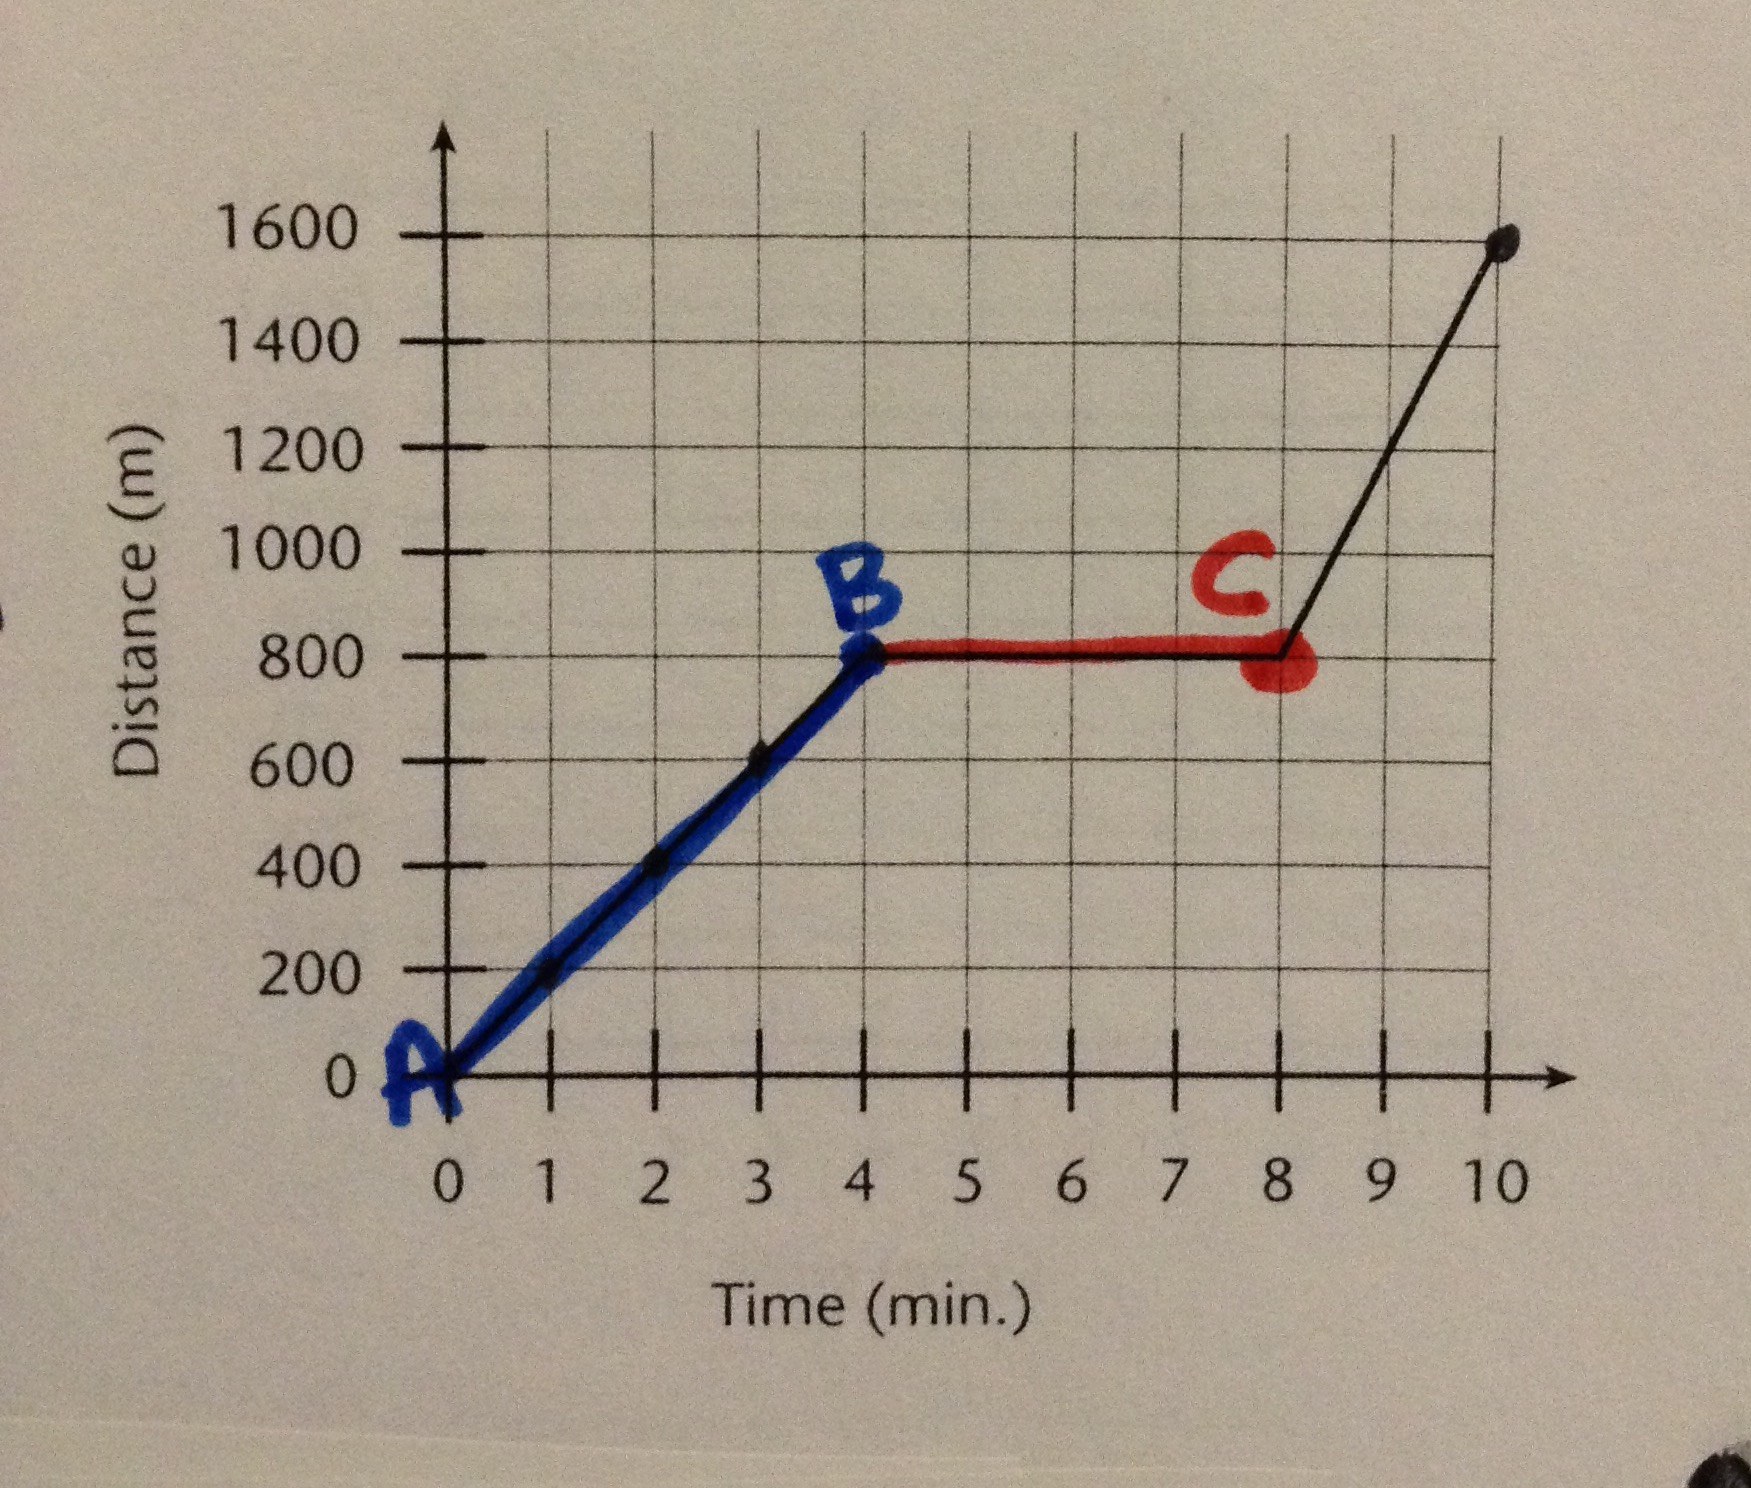
The graph shows Ashley riding her bike to Maria's house.
What was her average speed for the ENTIRE trip?
What was her average speed for the ENTIRE trip?
a)
1600 m/min
b)
200 m/min
c)
160 m/min
24.

At which point is the object not accelerating?
a)
0-90 seconds
b)
90-180 seconds
c)
180-240 seconds
d)
300-360 seconds
25.

What is the distance travelled in the first 90 seconds?
a)
2700m
b)
5400m
c)
2500m
d)
90m
26.

What is the acceleration from 0-90 seconds?
a)
15m/s
b)
3m/s
c)
1.5m/s
d)
9m/s
27.

What is the object doing from 240-270 seconds?
a)
Slowing down
b)
Speeding up in the opposite direction
c)
Stopped moving
d)
Speeding up in the same direction
100 %

