wayground logo

Bảng tính có thể in miễn phí

MỚI

Cỡ chữ

S
M
L
XL
bảng tính

1st Quarter Test

Total câu hỏi: 39

Worksheet time: 34mins

Tên
Lớp học
Ngày
1.

The response variable is:

a)

The variable we expect to explain or predict the value of the explanatory variable.

b)

Sometimes called the independent variable (IV)

c)

The variable we expect to change in response to the explanatory variable

d)

Also known as EV

2.

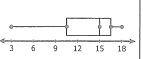
We wish to investigate the relationship between the number seeds planted in a garden and the number of fruit grown. The explanatory variable (EV) is

a)

The number of fruit grown

b)

The amount of soil in the garden

c)

The number of hours spent watering the plants

d)

The number of seeds planted

3.

We wish to investigate the relationship between the time spent shopping and the number of items bought. The response variable (RV) is

a)

The number of items bought

b)

The number of items at the shop

c)

The time spent shopping

d)

The time spent getting to the shops

4.

Which of the following is true?

a)

We use the response variable to explain changes that might be observed in the explanatory variable.

b)

The explanatory variable is the variable we expect to be explained by the response variable

c)

The response variable is also known as the predictor variable

d)

The explanatory variable is used to explain or predict the value of the response variable

5.

We wish to investigate whether a person’s age can be predicted from their IQ score. Which is the explanatory variable (EV)?

a)

Age

b)

IQ Score

c)

Both Age and IQ Score

d)

None of the Above

6.
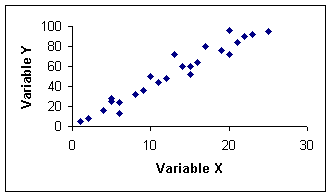
Describe the correlation in the graph shown.
a)
Strong Negative
b)
Strong Positive
c)
Weak Negative
d)
Weak Positive
7.
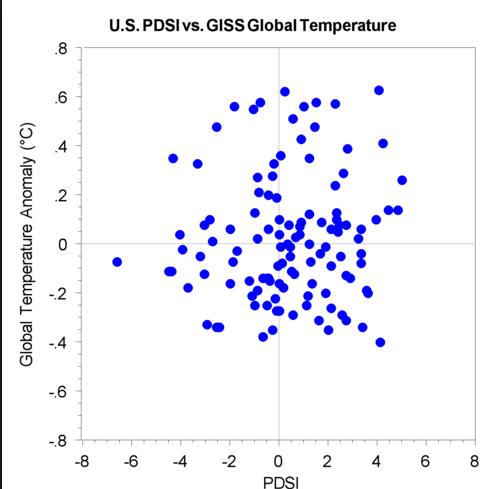
What type of association does this graph have?
a)
positive
b)
negative
c)
none
d)
all of the above
8.
r=0.3
a)
Strong positive 
b)
Weak positive
c)
Strong negative
d)
Weak negative 
9.
r=-0.89
a)
Strong positive 
b)
Weak positive 
c)
Strong negative 
d)
Weak negative 
10.
What type of association does this scatter plot represent?
a)
positive linear association
b)
negative linear association
c)
no association
d)
nonlinear association
11.

Determine the correlation coefficient of the given data:

a)

.9820

b)

-.9643

c)

-1.409

d)

.164

12.
Based on the graph, if Joe earned $400, how many hours did he work?
a)
15 hours
b)
20 hours
c)
25 hours
d)
30 hours
13.

What can we determine from the correlation coefficient (r)?

a)

Style + Type

b)

Percentage + Direction

c)

Strength + Direction

d)

Strength + Style

14.
If the correlation coefficient of a table of data is 0.85, what is true about the line of best fit?
a)
There is a weak, positive relationship
b)
There is a strong, positive relationship
c)
There is a weak, negative relationship
d)
There is a strong, negative relationship
15.
What would the correlation be between math grades and the time it takes to run a mile ?
a)
Postive Correlation
b)
Negative Correlation
c)
No Correlation
d)
Cannot Be Determined
16.
Name the correlation in this graph
a)
Positive Correlation
b)
Negative Correlation
c)
No Correlation
d)
Lots of Correlation
17.
Which best describes the form of this scatterplot?
a)
linear
b)
nonlinear
c)
scattered
18.
What does "m" represent in y=mx+b?
a)
y-intercept
b)
slope
c)
macaroni
d)
nothing
19.
What does 'b" represent in y=mx+b
a)
y-intercept
b)
beans
c)
nothing
d)
slope
20.
As x increases, y decreases, what kind of association( correlation) do we have:
a)
no correlation
b)
negative correlation
c)
correlation coefficient
d)
positive correlation
21.
What is a line of best fit used for?
a)
To make predictions
b)
To make the graph look pretty
c)
To connect the points
22.

 y=1.5x+46y=1.5x+46  is the trendline equation for hours spent studying (x) and test score (y).  What is the meaning of the slope, in context?

a)

For every 6 hours of studying, the test score increased by 1 point

b)

For every 1 hour of studying, the test score increased by 6 points

c)

For every 1 hour of studying, the test score increased by 1.5 points

d)

For every 1.5 hours of studying, the test score increased by 1 points

23.

 y=0.32x20.51y=0.32x-20.51  is the trendline equation that predicts the number of hits (y) for the number of times at bat (x).  How many hits should a coach expect if the player is at bat 175 times?

a)

35

b)

49

c)

609

d)

62

24.

The scatter plot below shows the average yearly consumption of bottled water by people in the United States starting in 1990. Using the line of best fit, predict the average consumption of bottled water in the year 2000?

a)

20 gallons

b)

18 gallons

c)

21 gallons

d)

19 gallons

25.

 A keyboarding instructor at a community college collected data comparing a student’s age and their typing speed. The equation for the line of best fit is given as y=1.4x+117.8y=-1.4x+117.8  , where x is the “age in years” and y is the “typing speed.  
How old would she predict a student is if they type 83 wpm?

a)

25

b)

16

c)

32

d)

50

26.
Type of Data arrangement
a)
Symmetrical
b)
Hairline
c)
Skewed Right
d)
Skewed Left
27.
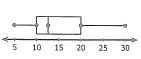
What is the interquartile range?
a)
4
b)
6
c)
2
d)
8
28.
a)

Skewed up

b)

Skewed down

c)

Skewed to the right

d)

Skewed to the left

29.
What is the shape of the distribution?
a)
Skewed Left 
b)
Skewed Right
c)
Symmetric
d)
Bimodal
30.

What is the median gas mileage for SUV's?

a)

19

b)

20

c)

21

31.

What is the mode?

a)

88%

b)

89%

c)

97%

d)

91%

32.
Which of the following best describes the shape of the distribution?
a)
SKEWED LEFT
b)
SKEWED RIGHT
c)
UNIFORM
d)
SYMMETRICAL
33.
Which of the following best describes the shape of the distribution?
a)
SKEWED LEFT
b)
SKEWED RIGHT
c)
UNIFORM
d)
SYMMETRICAL
34.
What is the mode?
a)
Number that occurs the most
b)
The Average
c)
The difference between the highest and lowest values
d)
The Number in the middle
35.
What is the mean?
a)
The number that occurs the most
b)
The number in the middle
c)
The difference between the highest and lowest values
d)
The Average
36.
What is the median?
a)
The number in the middle
b)
The difference between the highest and lowest values
c)
The number that occurs the most
d)
The average
37.
What is the minimum in this data set?
a)
0
b)
4
c)
9
d)
40
38.
What is the range of the data shown in the stem and leaf plot?
a)
40
b)
56
c)
136
d)
96
39.

How does the median number of miles driven for Driver A compare to the median number of miles driven for Driver B?

a)

Driver B drives much less than Driver A when comparing medians.

b)

The medians are the same

c)

Driver A drives much less than Driver B when comparing medians.

d)

Driver A and Driver B make the same amount of money.