wayground logo

Free Printable Worksheets

NEW

Font size

S
M
L
XL
Worksheets

Central Tendency and Variation and Plots

Total questions: 62

Worksheet time: 16hrs 30mins

Name
Class
Date
1.
If you score 76, 85, 97, and 82 on your math tests, what would your average score be? 
a)
82
b)
90
c)
85
d)
88
2.
Find the median of these numbers:
4, 2, 7, 5, 3, 5
a)
4
b)
5
c)
4.5
d)
6
3.
What is the range?
a)
average
b)
biggest-smallest
c)
the middle #
d)
# happening the most
4.
What is the median?
a)
biggest- smallest
b)
average
c)
the middle #
d)
# that happens the most
5.
What is the mean?
a)
# happening the most
b)
the number in the middle
c)
biggest-smallest
d)
the average
6.
What is the mode?
a)
# happening the most
b)
the average
c)
biggest - smallest
d)
the middle #
7.
What is the range of the set: 49, 68, 62, 47, 39, 54, 43
a)
25
b)
29
c)
31
d)
19
8.
Q2 or Quartile 2, can be also known as the what? 
a)
Range
b)
Mean
c)
Mode
d)
Median 
9.
What is the maximum for this set of data?
a)
8
b)
9
c)
7
d)
I cannot tell
10.
Inside "the box", what percent of our data is there? 
a)
75%
b)
25%
c)
100%
d)
50%
11.
On a box and whisker plot, how do you find the 3rd Quartile (Q3)?
a)
Find the median
b)
Find the median of the LOWER HALF
c)
Find the median of the UPPER HALF
d)
Add all numbers and divide by 3
12.
What is the median of this stem and leaf plot? 
a)
148
b)
146
c)
147
d)
149
13.
What is the mean of this Stem and Leaf Plot?
a)
22.75
b)
22
c)
21
d)
26
14.
What is the Mode?
  22,7,22,1,7,18,18,16,6,6,7
a)
7
b)
18
c)
21
d)
6
15.
The salary of the employees in the office were $15,000; $18,000; $16,000; $14,000; $90,000; and $17,000.  What is the best measure of the central tendency of the salaries?
a)
Mean
b)
Median
c)
Mode
d)
Range
16.
The heights of the starting 5 players on a basketball team are 60 inches, 67 inches, 64 inches, and 65 inches.  If the mean or balance point of the players is 65, what is the height of the 5th player?
a)
70
b)
69
c)
61
d)
68
17.
The number of pages that Carolyn wrote in her journal each day from Monday to Friday is shown below: 
9, 8, 12, 6, 10
What is the mean number of pages she wrote per day?
a)
5
b)
6
c)
9
d)
11
18.
What is the mode?
a)
The value that occurs the most often in a data set
b)
The middle number in an ordered set of data
c)
The sum of all the numbers in a data set divided by the size
d)
The sum of the between the greatest and the least elements, divided by two
19.

Calculate the range of the following

2, 5, 8, 3, 13, 5

a)
11
b)
13
c)
5
d)
8
20.

find the lower quartile of the following set of scores

12, 9, 4, 6, 5, 8, 9, 4, 10, 2

a)
10
b)
4
c)
9
d)
6
21.

Calculate the interquartile range of the following data:

17, 18, 18, 19, 20, 21, 21, 23, 25

a)

3

b)

4

c)

5

d)

8

22.
Order the data and find the Q1
2,3,3,3,4,4,4,5,5,5,5,6,6,6,6,6,7,7,8,8,8,9,9
a)
3
b)
4
c)
5
d)
6
23.
True or False
To find the IQR (interquartile range) you have to add the Q3 + Q1.
a)
True
b)
False
24.
Order the data and find the median or Q2
2,3,3,3,4,4,4,5,5,5,5,6,6,6,6,6,7,7,8,8,8,9,9
a)
3
b)
4
c)
5
d)
6
25.
Order the data and find the Inter- Quartile Range (IQR)
2,3,3,3,4,4,4,5,5,5,5,6,6,6,6,6,7,7,8,8,8,9,9
a)
3
b)
4
c)
5
d)
6
26.
All of the below sets have the same mean.
Set 1-Standard Deviation=3.1
Set 2-Standard Deviation=4.9
Set 3-Standard Deviation=1.7
Set 4-Standard Deviation=3.2
Which set of data probably has the points closest to the mean?
a)
1
b)
2
c)
3
d)
4
27.
This data is normally distributed.  What percent of the data is in the shaded region?
a)
68%
b)
95%
c)
99.7%
d)
50%
28.
The mean life of a tire is 30,000 km. The standard deviation is 2000 km.

Then, 68% of all tires will have a life between ___________ km and __________ km.
a)
 28,000 km and 32,000 km.
b)
24,000 km and 34,000 km.
c)
26,000 km and 34,000 km.
d)
27,000 km and 31,000 km.
29.
What shape is a normal distribution curve?
a)
Half curve
b)
Round curve
c)
Bell curve
d)
Square curve
30.

Given a mean of 75 and a standard deviation of 7, what percentage of scores are between 75 and 82?

a)

68%

b)

81.5%

c)

16%

d)

34%

31.
What type of graph is shown?
a)
Hisotgram
b)
Frequency Polygon
c)
Ogive
d)
Line graph
32.
What type of graph is shown?
a)
Hisotgram
b)
Frequency Polygon
c)
Ogive
d)
Line graph
33.
What type of graph is shown?
a)
Hisotgram
b)
Frequency Polygon
c)
Ogive
d)
Bar graph
34.
According to the portion of the frequency table given, how many people have an MBA?
a)
9
b)
60
c)
20
d)
not enough information
35.
What is an ogive graph?
a)
Cumulative Frequency Graph
b)
Frequency Graph
c)
Relative Frequency Graph
d)
A pie chart
36.

What is the cumulative frequency of the 3rd class in this distribution?

a)

1

b)

14

c)

15

d)

24

37.

How many universities were surveyed?

a)

11

b)

12

c)

13

d)

14

38.

What is the difference between relative frequency and cumulative frequency?

a)

Relative frequency of a class is the proportion of the data in that class, while cumulative frequency of a class is the number of observations in that class.

b)

Relative frequency of a class is the percentage of the data that falls in that class, while cumulative frequency of a class is the sum of the frequencies of that class and all previous classes.

c)

Relative frequency of a class is the number of observations in that class, while cumulative frequency of a class is the sum of all the frequencies.

d)

There is no difference between the two.

39.

Use the frequency histogram to answer each question.

Determine the number of classes.

a)

7

b)

6

c)

8

d)

5

40.

This is the interval between two consecutive upper (or lower) class limits.

a)

class width

b)

class boundaries

c)

midpoints

d)

frequency

41.

How do you calculate the class width if you have a data set of 70 entries and you are asked to construct a 6 class frequency distribution?

a)

I divide 70/6=11.66666, I round it up to 12; the class width is 12.

b)

I divide 6/70=0.875, I round it up to 9; the class width is 9.

c)

I choose a class width of 10 because it looks fine.

d)

As there are 70 entries, each class width is 6.

42.

Find the midpoints.

a)

25.5, 35.5, 45.5, 55.5, 65.5, 75.5

b)

20.5, 30.5, 40.5, 50.5, 60.5, 70.5, 80.5

c)

21, 31, 41, 51, 61, 71

d)

30, 40, 50, 60, 70, 80

43.

Find the cumulative frequencies.

a)

28, 56, 84, 100

b)

28, 58, 70, 72, 74, 76

c)

33%, 37%, 20%, 7%, 7%, 7%

d)

28, 30, 12, 2, 2, 2

44.

This is an ogive.

a)

true

b)

false

45.
How many employees have a salary less than $22,000?
a)
50
b)
350
c)
0
d)
10
46.
There are 200 vegetable plants in a garden.  How many of the vegetable plants are green beans?
a)
16
b)
24
c)
28
d)
32
47.

600 people were surveyed. How many people rode the stationary bikes that day?

a)

150 people

b)

120 people

c)

90 people

d)

None of these

48.
According to this graph, what is the most popular flavor of Jolly Rancher?
a)
Cherry
b)
Grape 
c)
Blue Raspberry
d)
Watermelon
49.
Stanley's family went camping for 4 nights in Big Bend.  Every night they counted stars.  At the end of the trip they had counted 124 stars.  The chart below shows how many they counted each night.
How many stars did they count on the 4th night?
a)
39
b)
41
c)
161
d)
44
50.
How many more students like soccer than hockey?
a)
29
b)
20
c)
9
d)
11
51.

In a pareto chart, data has to be in ____.

a)

any order

b)

ascending order

c)

descending order

d)

none of these

52.

Which of the following is a pareto chart?

a)
b)
c)
d)
53.
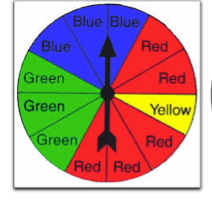
What is the probability of spinning green?
a)
0
b)
1/4
c)
1/2
d)
3/4
54.
The letters that form the word ALGEBRA are placed in a bowl. What is the probability of choosing a letter other than “A”? 
a)
2/7
b)
5/49
c)
5/7
d)
10/49
55.
A bag contains 30 pieces of candy. There are 15 grape, 7 cherry, 3 lemon, 5 strawberry. What is the probability of drawing a lemon?
a)
3
b)
1/10
c)
3/10
d)
30%
56.

Two dice are rolled. What is the probability that the sum is greater than or equal to 9?

a)

13/18

b)

5/6

c)

5/18

d)

1/6

e)

2/3

57.

Two dice are rolled. What is the probability that the sum is less than 9?

a)

13/18

b)

5/6

c)

5/18

d)

1/6

e)

2/3

58.

Two dice are rolled. What is the probability that the sum is 9?

a)

1/4

b)

1/9

c)

5/12

d)

7/12

e)

1/12

59.

Two dice are rolled. What is the probability that the sum is even?

a)

1/2

b)

1/18

c)

17/18

d)

17/36

e)

19/36

60.

Two dice are rolled. What is the probability that the sum is a multiple of 5?

a)

2/9

b)

1/6

c)

1/18

d)

7/36

e)

1/4

61.

Two dice are rolled. What is the probability that the sum is not 6?

a)

5/36

b)

1/6

c)

5/18

d)

13/18

e)

31/36

62.

Two dice are rolled. What is the probability that the sum is 7 or 8?

a)

13/36

b)

1/4

c)

5/18

d)

11/36

e)

1/3