wayground logo

Free Printable Worksheets

NEW

Font size

S
M
L
XL
Worksheets

Unit 2A Quiz Review Problems

Total questions: 66

Worksheet time: 17hrs 30mins

Name
Class
Date
1.
The number of siblings you have and your weight. 
a)
Positive correlation
b)
Negative correlation
c)
No correlation
d)
All of the above
2.
As x increases, y increases
a)
correlation coefficient
b)
causation
c)
positive correlation
d)
negative correlation
3.
Which scatter plot shows a linear relationship between x and y?
a)
Graph A
b)
Graph B
c)
Graph C
d)
Graph D
4.
As the age of the car increases, its value decreases. Which scatterplot represents this relationship?
a)
A
b)
B
c)
C
d)
D
5.
If a scatterplot has no association then...
a)
...it has no ordered pairs
b)
...it has ordered pairs that have a negative pattern
c)
...its ordered pairs have no predictable pattern
d)
...if it makes a lion on a graph (roar!)
6.
Which of the following could be a possible line of best fit for the data?
a)
y = -5/2x + 20
b)
y = -x + 19
c)
y = x + 20
d)
y = 2/3x + 15 
7.
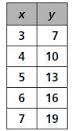
A restaurant sells pizza for the prices in the data table.  Calculate the linear regression equation of the data.
a)
y = 1.5x + 12
b)
y = 12x + 1.5
c)
y = 0.67x - 8
d)
y = -8x + 0.67
8.
Find the equation of the line of best fit for the given data
a)
y=163.41x + 4.19
b)
y=-163.41x + 4.19
c)
y=-4.19x + 163.41
d)
y= 4.19x - 163.41
9.
You are analyzing a scatter plot that has a negative correlation. What is true of the of the x and y values?
a)
As x increases, y decreases
b)
As x increases, y increases
c)
As x decreases, y decreases
10.
Which scatter plot shows a linear relationship between x and y?
a)
Graph A
b)
Graph B
c)
Graph C
d)
Graph D
11.
In this image, how would you describe the point that does not fit the pattern of the other dots?
a)
The point is a linear model.
b)
The point is an outlier.
c)
The point is the range.
d)
The point is the median.
12.
The scatterplot below suggests which of the following types of data relationship?
a)
Weak, negative
b)
weak, positive
c)
strong, negative
d)
strong, positive
13.
Describe the correlation in the graph shown.
a)
Strong Negative
b)
Strong Positive
c)
Weak Negative
d)
Weak Positive
14.
Which of the following lines represents the line of best fit for the scatter plot?
a)
A
b)
B
c)
C
d)
D
15.
What does the slope represent in this situation?
a)
The sloth runs 1 feet in 3 minutes
b)
The sloth runs 3 feet in 1 minute
c)
The sloth runs fast
d)
The sloth runs 6 feet in 1 minute
16.
Which equation best represents the data?
a)
A.  y= -3/5x + 2
b)
B  y = 5/3x -2 
c)
C  y = -3/5x - 2
d)
D  y= 5/3x + 2
17.
Which equation best represents the data?
a)
A  y = 2x + 2
b)
B  y= 1/2x - 2
c)
C  y = -2x + 2
d)
D  y = -1/2x + 2
18.
Which scatterplot most likely has a line of best fit represented by y = - 2x + 1
a)
W
b)
X
c)
Y
d)
Z
19.
Find the slope
a)
-2/3
b)
3/2
c)
-3/2
d)
2/3
20.

Find the slope of:

(1,8) and (3,12)

a)

2

b)

1/2

c)

9/7

d)

-2

21.
Find the Slope
a)
No Slope
b)
3
c)
1/3
d)
Zero
22.
Which equation matches the table?
a)
y = 3x + 9
b)
y = x + 9 
c)
y = x + 3
d)
y = 12x - 3
23.
Given the table, write the equation in the slope-intercept form.
a)
y = 1/3x + 6
b)
y = 3x + 6
c)
y = 2x + 6
d)
y = 1/2x + 6
24.
What is the equation for the table?
a)
y =1/4x -3
b)
y =4x - 3
c)
y = -3x -3 
d)
y =-2x -3 
25.
Solve for x:
5x - 14 = 8x + 4
a)
x = 6
b)
x = -6
c)
x = -18/13
d)
x = 10/3
26.
Solve for x:
4(1-x)+3x=-2(x+1)
a)
x = -6
b)
x = 6
c)
x = 3
27.
Solve:
5y+34 = -2(-7y+1)
a)
y = -4
b)
y = 9
c)
y = 4
d)
y = 36/19
28.
Residuals are . . . 
a)
possible models not explored by the researcher
b)
variation in the response variable that is explained by the model
c)
the difference between the observed response and the values predicted by the model
d)
data collected from individuals that is not consistent with the rest of the group
29.
After performing analyses on a set of data, Mrs. Schoeneck examined the scatter plot of the residual values for each analysis. Which scatter plot indicated the best linear fit for the data?
a)
A
b)
B
c)
C
30.
Shown is a residual plot. Would a linear regression model of the data be most appropriate?
a)
YES
b)
NO
31.
The correlation coefficient r is a value between
a)
0 and 1
b)
0 and 100
c)
-1 and 1
d)
-2 and 2
32.
What type of correlation exists between the temperature outside and the number of hot chocolate sold at a football game.
a)
positive
b)
negative 
c)
no correlation
d)
unknown
33.

Which equation do you use to calculate the residual?

a)

predicted - observed

b)

run / rise

c)

observed - predicted

34.

Estimate the correlation coefficient (or the r-value).

a)

r = 0.8

b)

r = -0.5

c)

r = 0.5

35.
a)
This residual graph represents a linear fit.
b)
This graph represents a nonlinear fit.
c)
This residual graph represents no fit.
36.

Shown is a residual plot. How many negative residuals are there?

a)

5

b)

1

c)

3

d)

9

37.

Shown is a residual plot. How many positive residuals are there?

a)

5

b)

1

c)

3

d)

9

38.
Which residual plot shows that a linear regression model would be most appropriate?
a)
a
b)
b
c)
c
39.
Shown is a residual plot. Would a linear regression model of the data be most appropriate?
a)
YES
b)
NO
40.

Which example shows CAUSATION? (Which one CAUSED the other to happen.)

a)

High social media usage and reduced grades.

b)

Car ran out of gas and being stranded on the side of the road.

c)

Recess time and number of friends.

41.

Which example shows CAUSATION? (Which one CAUSED the other to happen.)

a)

Rainfall and time spent reading.

b)

Eating more butter and increased divorce rates.

c)

It started raining and the baseball game was delayed.

42.

Which example shows CORRELATION? (The events show correlation, but one thing does NOT cause the other thing to happen.)

a)

I put water in the freezer and now I have ice.

b)

The alarm clock went off and I woke up.

c)

Temperature and the amount of people at the beach.

43.

Which example shows a CORRELATION? (The events show correlation, but one thing does NOT cause the other thing to happen.)

a)

It rained and the ground is wet.

b)

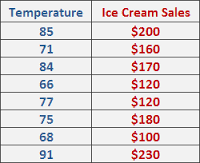
Ice cream sales increase as temperature increases.

44.
A perfect negative correlation has a correlation coefficient of ____. 
a)
1
b)
-1
c)
0
45.
If there is NO correlation, the correlation coefficient is ____. 
a)
1
b)
-1
c)
0
46.

the speed you drive and the amount of fuel you use

a)

Correlation

b)

Causation

47.

the inches of snowfall and the number of heart attacks

a)

Correlation

b)

Causation

48.

when it rains several inches, the water level of a lake increases

a)

Correlation

b)

Causation

49.

when ice cream sales increase, incidents of sunburn increase

a)

Correlation

b)

Causation

50.
Jimmy is filling a pool with water.  The pool has 78 gallons already inside.  The hose is filling it at a rate of 3 gallons per minute.  What is the y-intercept for this problem?
a)
78/3
b)
78
c)
3
d)
3/78
51.
Lonnie plans to join the gym.  He must pay a $35 membership fee.  He will then pay $5 each month.  What is the slope?
a)
7
b)
35
c)
5
d)
1/7
52.
What is the y-intercept of this graph?
a)
(0,1)
b)
(0,-2)
c)
(0,0)
d)
(0,3)
53.
which equation produces the line on the graph
a)
y = x + 3
b)
y = 3x - 3
c)
y = -x - 3
d)
y = -3x + 3
54.
Write the equation of the line.
a)
y = -2/3x + 4
b)
y = 2/3x + 4
c)
y = 3/2x + 4
d)
y = -3/2x + 4
55.

Which graph matches this equation y=2x+1

a)
b)
c)
56.
What does the slope mean in the context of the problem?
a)
The cost will increase by $1.40 per topping
b)
The cost will decrease by $1.40 per topping
c)
The cost will increase by $1.90 per topping
d)
The cost will decrease by $1.90 per topping 
57.
What is the meaning of the y-intercept?
a)
The hamburger will cost $1.90 without any toppings.
b)
The hamburger will cost $1.40 without any toppings. 
c)
The cost of the hamburger is $1.90 with one topping
d)
The cost of the hamburger doesn't change no matter how many toppings there are.
58.
What is the meaning of the slope?
a)
The cost to get into the fair is $5
b)
The total cost for the day will increase by $1.75 for every ride you go on.
c)
The cost to get into the fair is $1.75
d)
The total cost for the day will increase by $5 for every ride you go on. 
59.
What is the meaning of the y-intercept?
a)
The cost per ride is $1.75
b)
The cost per ride is $5
c)
The cost to get into the fair is $5
d)
The cost to get into the fair is $1.75
60.
Data was collected on the weight of a male  laboratory rat for the first 25 weeks after its birth. The linear regression equation is 
y= 40x+100, where x is number of weeks and y is weight in grams. 
What does the y-intercept mean in context of the problem?
a)
The predicted weight of the rat in year 0. 
b)
The predicted weight of the rat at birth. 
c)
The current weight of the rat. 
d)
The average increase in the rat's weight. 
61.
The linear regression equation is y = 61.93x - 1.79.  According to the model, the slope can be interpreted as:
a)
After 0 hours of driving, they went 61.93 miles.
b)
They drove at a speed of 61.93 miles per hour.
c)
They drove 61.93 miles total.
d)
They drove 61.93 hours total.
62.
A restaurant sells pizza for the prices in the data table.  Calculate the linear regression equation of the data.
a)
y = 1.5x + 12
b)
y = 12x + 1.5
c)
y = 0.67x - 8
d)
y = -8x + 0.67
63.
The table shown is comparing a person's foot length to their height in cm. Calculate a line of best fit.
a)
f(x) = 25.05x + 5.57
b)
f(x) = 5.57x + 25.05
c)
f(x) = -5.57x + 25.05
d)
f(x) = 5.57x - 25.05
64.
The chart below tracts starting salaries for health care workers since the year 2000. Using linear regression, find the equation of best fit. Round decimals to 3 places.
a)
y = 839.721x + 27541.812
b)
y = 27541.812x - 839.721
c)
y = 27541.812x + 839.721
d)
y = 839.721x - 27541.812
65.

The residual plots from five different least squares regression lines are shown below. Which of the plots shows the strongest evidence that its regression line is an appropriate model for the data and is consistent with the assumptions required for inference for regression?

a)
b)
c)
d)
e)
66.

Which of the following scatter plots could have created the residual plot below?

a)
b)
c)
d)
e)