wayground logo

Free Printable Worksheets

Font size

S
M
L
XL
Worksheets

Statistics

Total questions: 20

Worksheet time: 54mins

Name
Class
Date
1.

Calculate the MEAN for the data set: 6, 7, 12, 8, 7, 4, 8, 8, 7

a)

7

b)

7.44

c)

8

d)

7 and 8

2.

Calculate the MEDIAN for the data set: 6, 7, 12, 8, 7, 4, 8, 8, 7

a)

7

b)

7.44

c)

8

d)

7 and 8

3.

Calculate the MODE for the data set: 6, 7, 12, 8, 7, 4, 8, 8, 7

a)

7

b)

7.44

c)

8

d)

7 and 8

4.

Calculate the RANGE for the data set: 6, 7, 12, 8, 7, 4, 8, 8, 7

a)

7

b)

7.44

c)

8

d)

7 and 8

5.

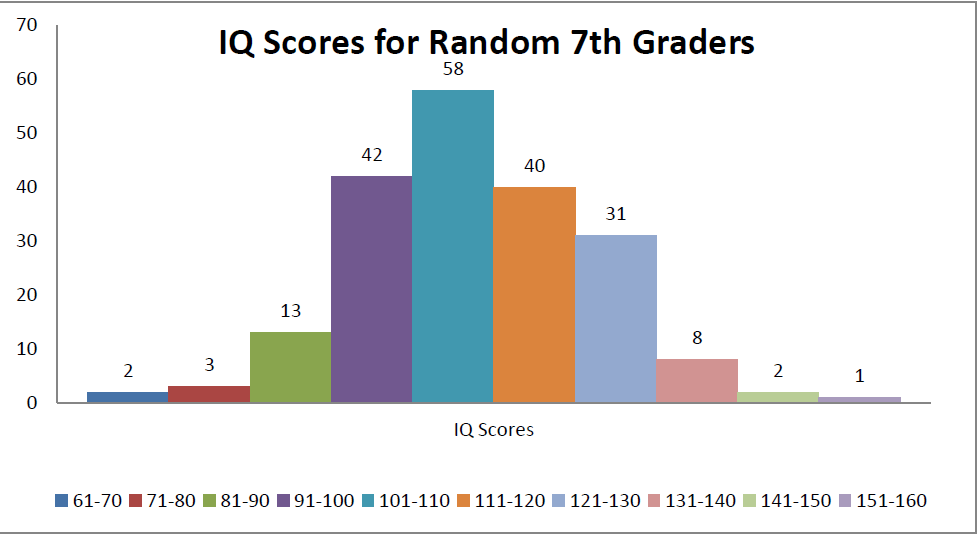
Calculate the relative frequency of having an IQ score in the 131-140 range. (200 7th graders were surveyed).

a)

8%

b)

4%

c)

20%

d)

15.5%

6.

How many 7th graders had an IQ score in the 81-90 range?

a)

13

b)

6.5

c)

3

d)

42

7.

What was the most common IQ range?

a)

91-100

b)

111-120

c)

12-130

d)

101-110

8.

How many data points are greater than 34?

a)

10

b)

11

c)

12

d)

13

9.
Which interval has the highest frequency?
a)
9 - 10 books
b)
7-8 Books
c)
5-6 Books
d)
3-4 Books
10.
How many total students are in the science class?
a)
13
b)
6
c)
27
d)
25
11.
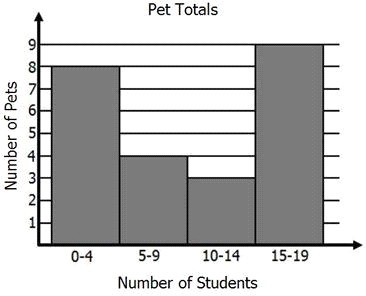
Students at Cooper Elementary school took a survey about what kinds of pets they had at home. Then, students plotted that information on a frequency table.
How many kids have dogs and cats for pets?
a)
19
b)
12
c)
7
d)
20
12.
Which interval shows the greatest number of pets?
a)
15-19
b)
0-4
c)
5-9
d)
10-14
13.

Statistics are used...

a)

in education

b)

in science

c)

in government

d)

in mathematics

e)

all of the answer choices

14.
What is the MODE of a data set?
a)
The middle value
b)
The number that occurs most frequently
c)
The average
d)
The difference between the max and min values
15.
What is the MEDIAN of a data set?
a)
The middle value
b)
The number that occurs most frequently
c)
The average
d)
The difference between the max and min values
16.
What is the RANGE of a data set?
a)
The middle value
b)
The number that occurs most frequently
c)
The average
d)
The difference between the max and min values
17.

Which hero was least popular?

a)

Spiderman

b)

Batman

c)

The Hulk

d)

Superman

18.
How many students like vanilla and chocolate?
a)
8
b)
32
c)
30
d)
28
19.
Which Continent is home to 36% of the wild cats?
a)
Asia
b)
Africa
c)
North America
d)
South America
20.
A PIE Chart is created using
a)
Cherries
b)
Apples
c)
Data
d)
Cars